Copyright
©The Author(s) 2025.
World J Gastrointest Oncol. Feb 15, 2025; 17(2): 97125
Published online Feb 15, 2025. doi: 10.4251/wjgo.v17.i2.97125
Published online Feb 15, 2025. doi: 10.4251/wjgo.v17.i2.97125
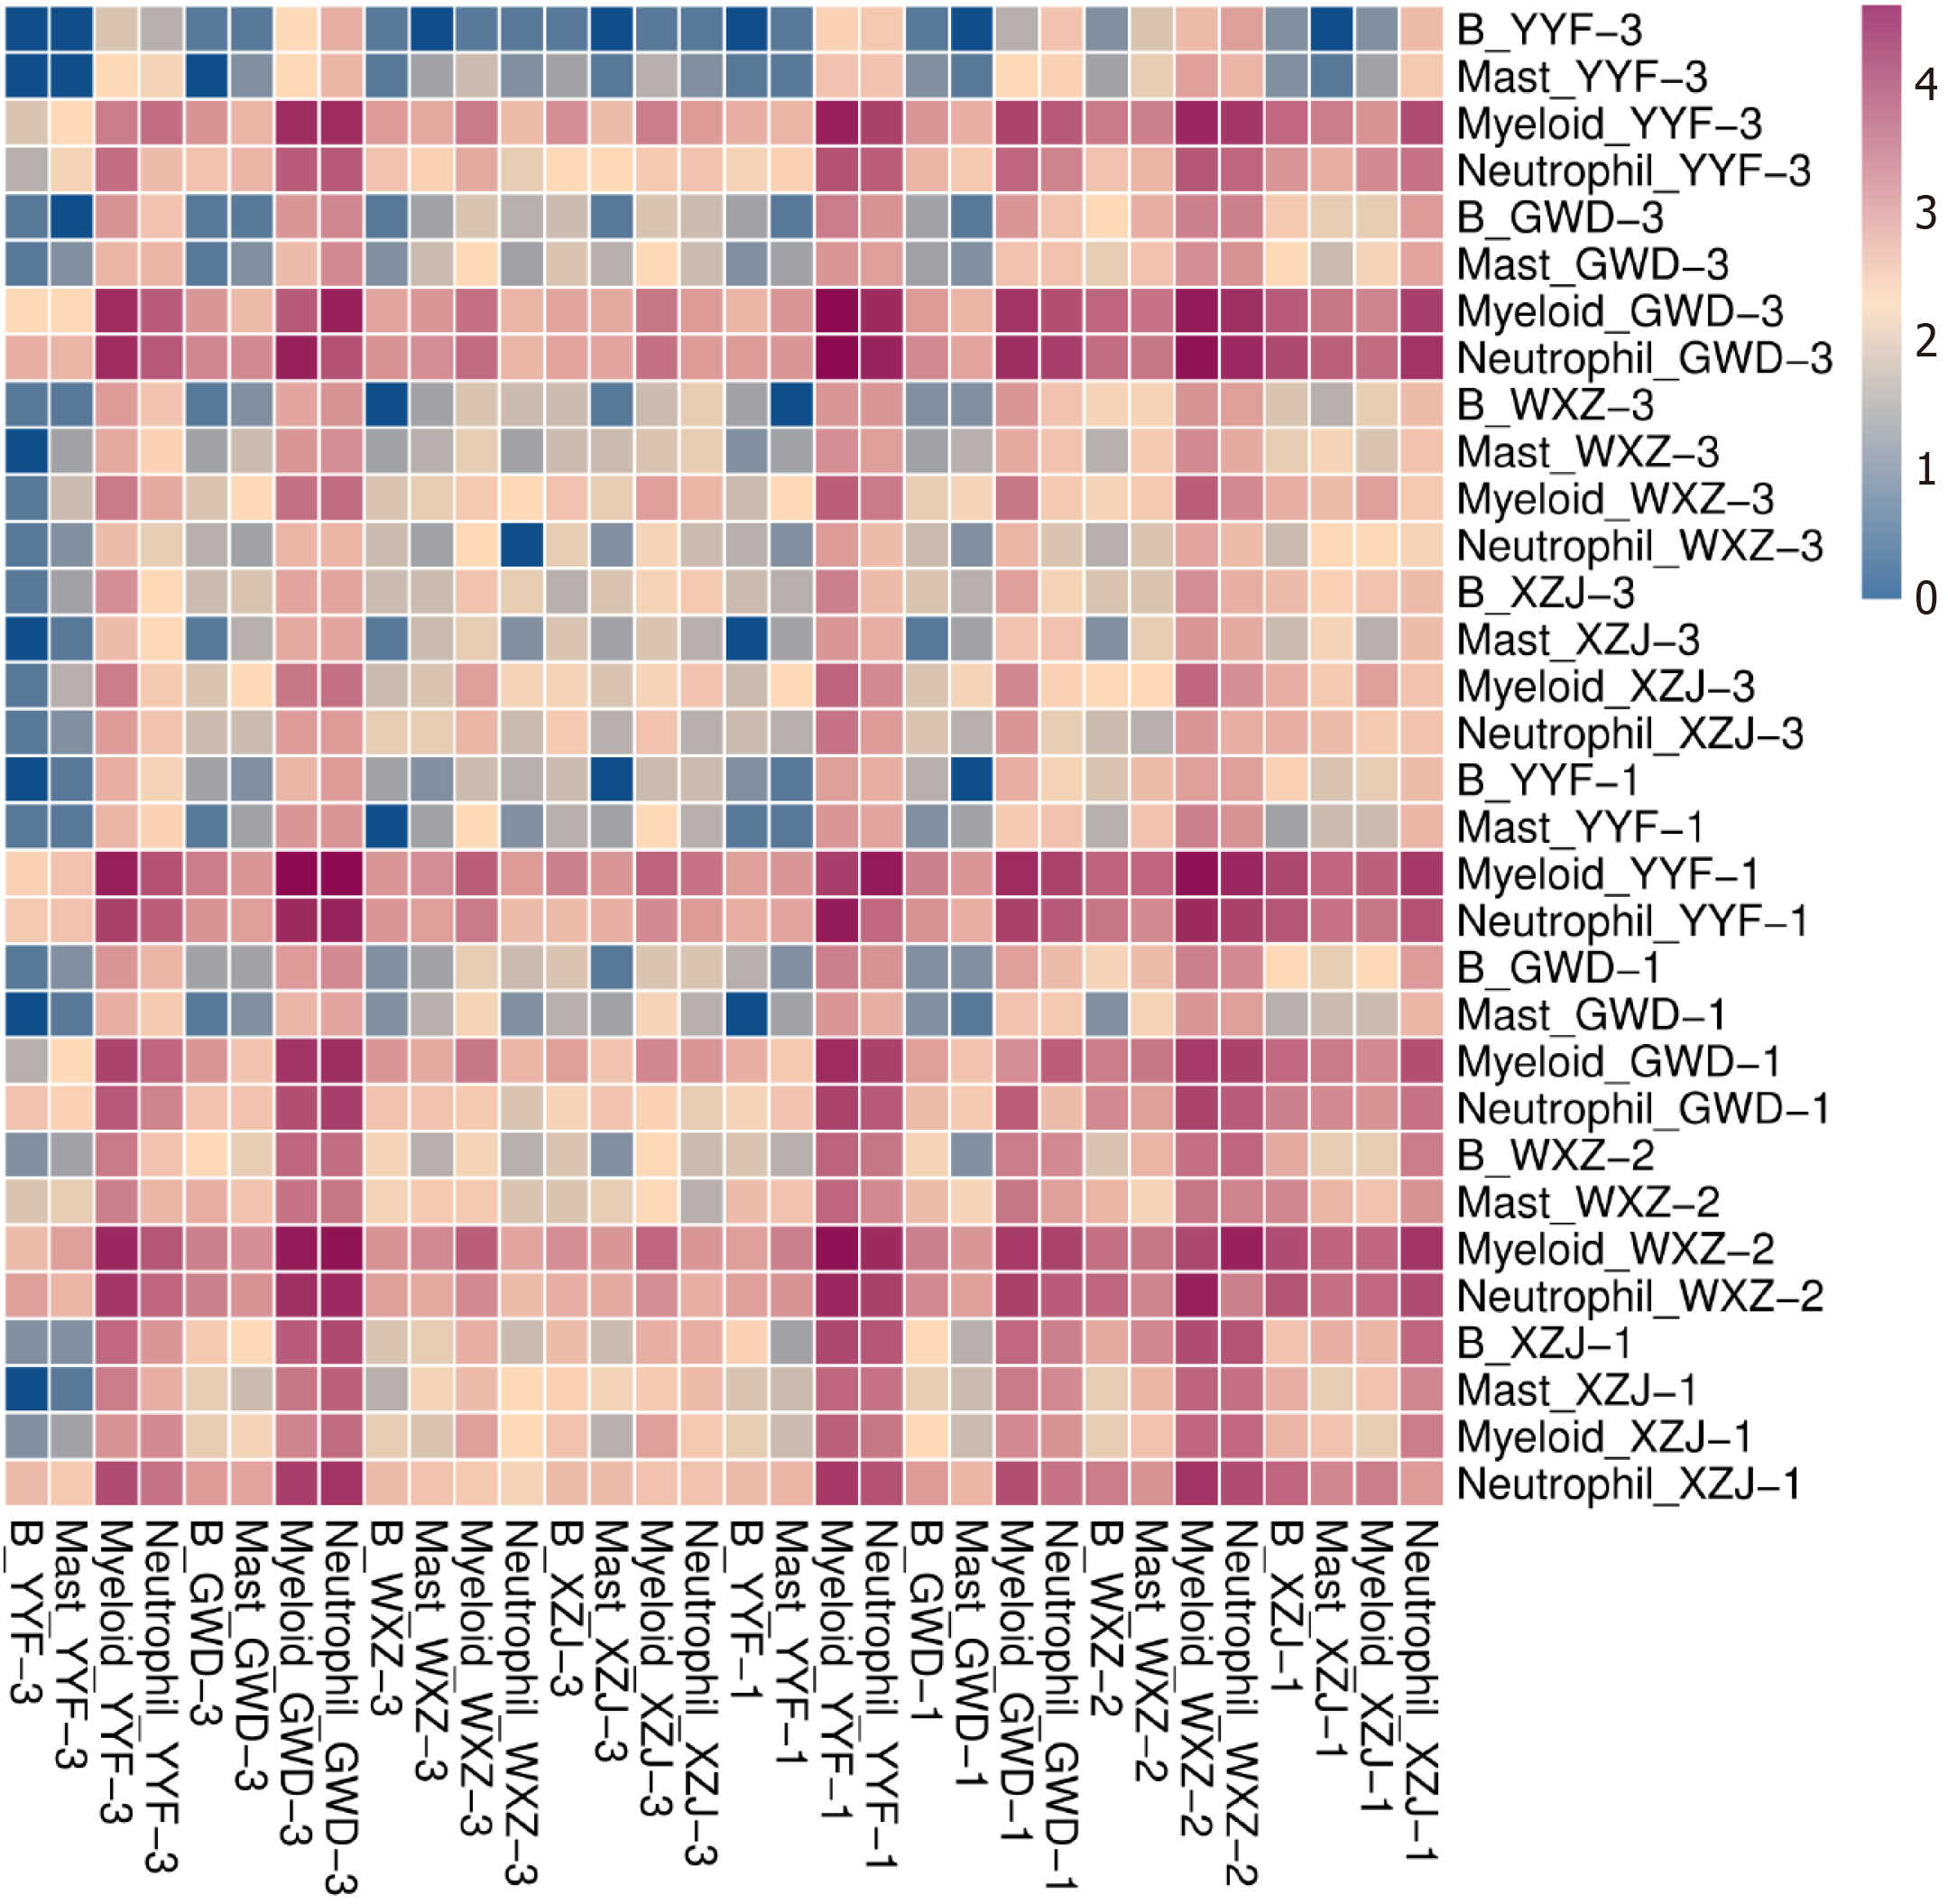
Figure 6 Cell-cell interactions.
The rows and columns in the heatmap representing different cell types across various tissue samples, respectively. The colors indicating the degree of intercellular interaction, ranging from blue (0) to red (4), with higher values denoting stronger intercellular activity.
- Citation: Tang XS, Xu CL, Li N, Zhang JQ, Tang Y. Landscape of four different stages of human gastric cancer revealed by single-cell sequencing. World J Gastrointest Oncol 2025; 17(2): 97125
- URL: https://www.wjgnet.com/1948-5204/full/v17/i2/97125.htm
- DOI: https://dx.doi.org/10.4251/wjgo.v17.i2.97125


