Copyright
©The Author(s) 2025.
World J Gastrointest Oncol. Feb 15, 2025; 17(2): 97125
Published online Feb 15, 2025. doi: 10.4251/wjgo.v17.i2.97125
Published online Feb 15, 2025. doi: 10.4251/wjgo.v17.i2.97125
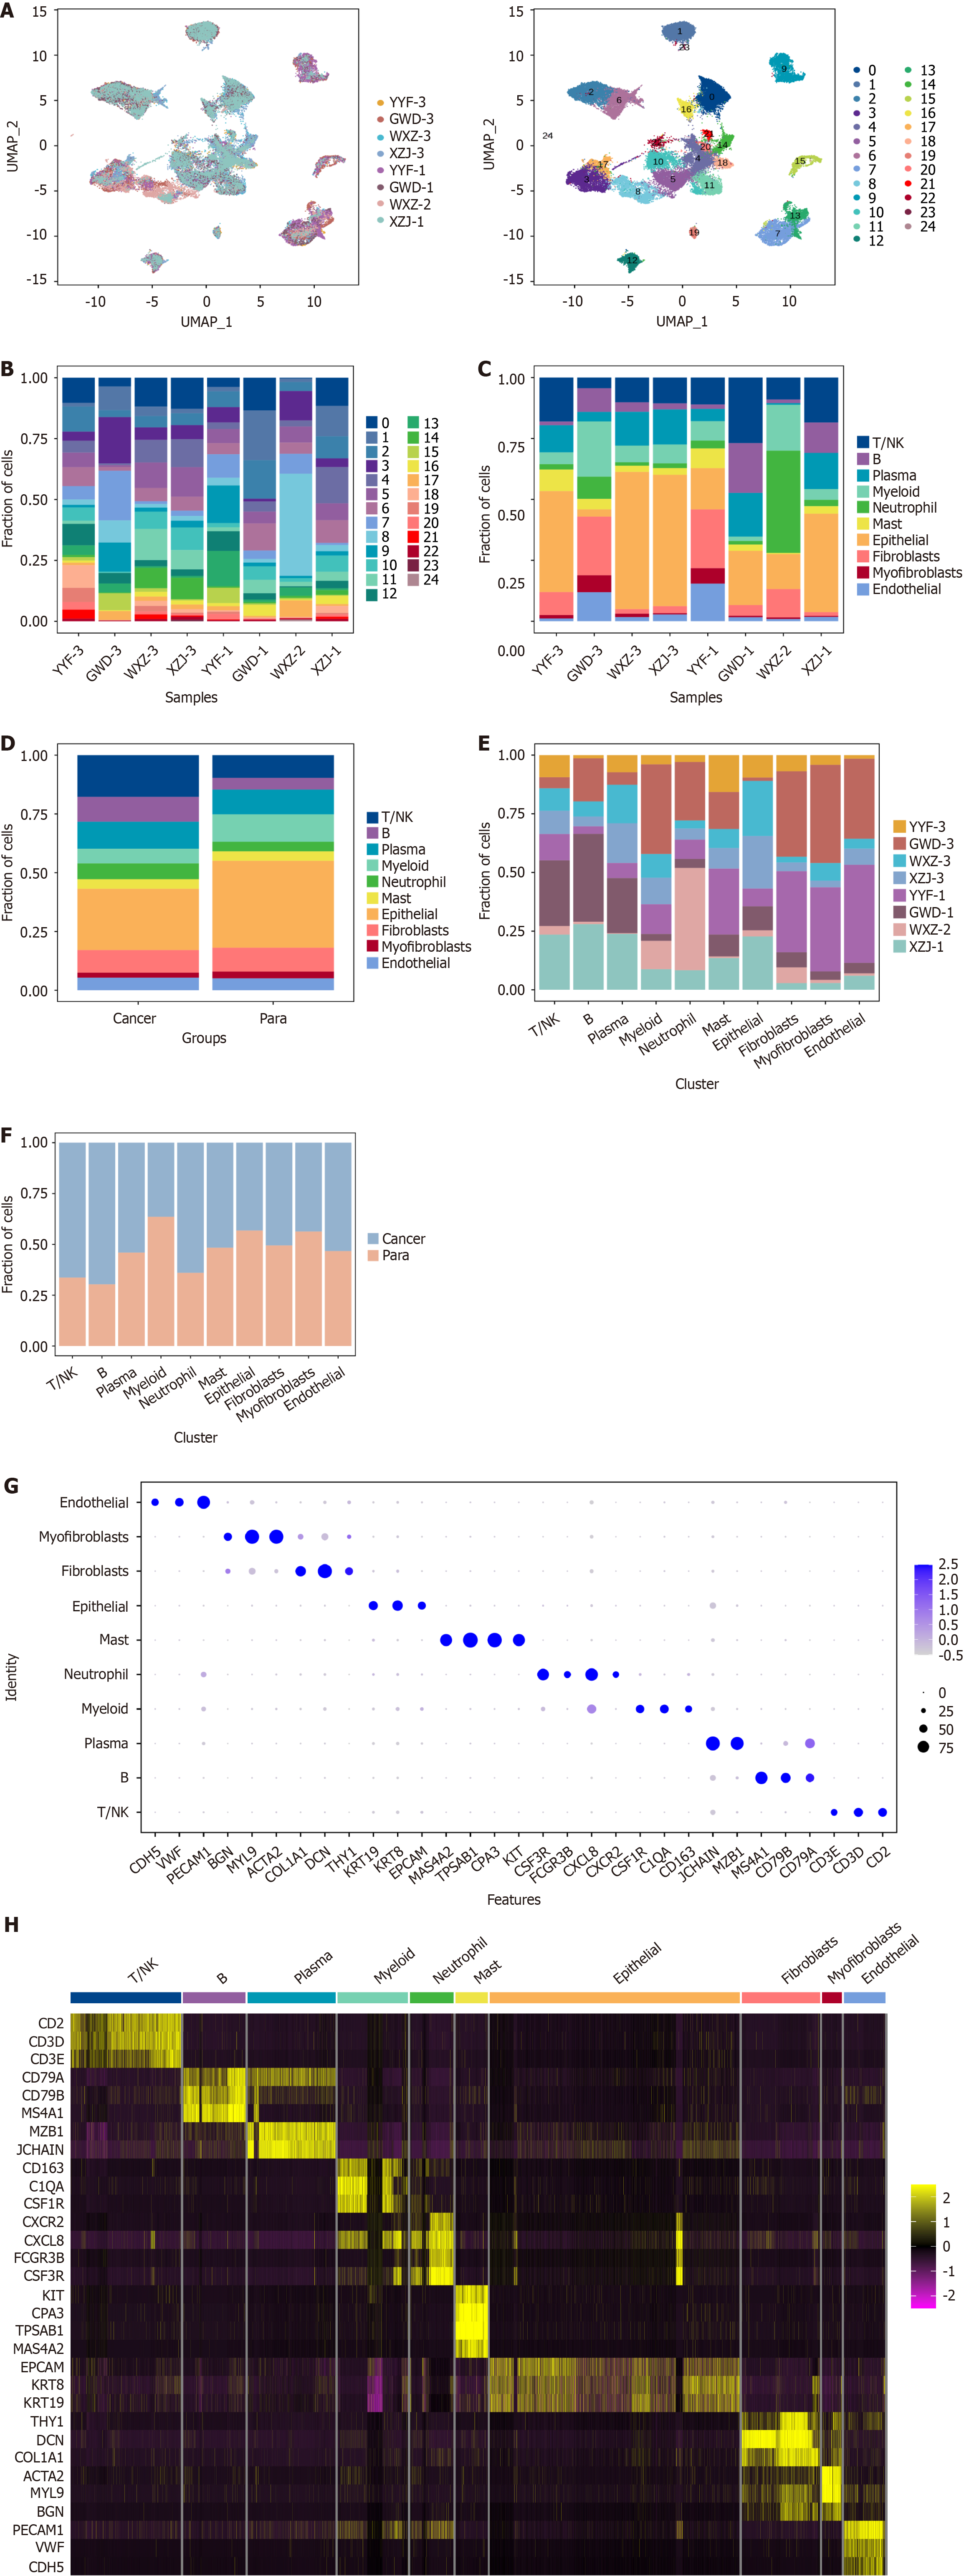
Figure 1 Global single-cell atlas of four different stages of gastric cancer.
A: Single-cell atlas of 73645 cells captured from 25 cell clusters. Tissue samples are shown on the left, and cell clusters on the right, with colors indicating cell types; B and C: Composition of cell clusters and cell types within various tissue samples (n = 8); D: Proportion of different cell types in cancer (n = 4) and para cancerous tissues (n = 4); E: Tissue sample distribution in different cell types; F: Distribution of cancer and para cancerous tissues across varying cell types; G and H: Dot Plot and Heatmap of the corresponding marker genes identifying the cell types.
- Citation: Tang XS, Xu CL, Li N, Zhang JQ, Tang Y. Landscape of four different stages of human gastric cancer revealed by single-cell sequencing. World J Gastrointest Oncol 2025; 17(2): 97125
- URL: https://www.wjgnet.com/1948-5204/full/v17/i2/97125.htm
- DOI: https://dx.doi.org/10.4251/wjgo.v17.i2.97125


