Copyright
©The Author(s) 2025.
World J Gastrointest Oncol. Feb 15, 2025; 17(2): 100167
Published online Feb 15, 2025. doi: 10.4251/wjgo.v17.i2.100167
Published online Feb 15, 2025. doi: 10.4251/wjgo.v17.i2.100167
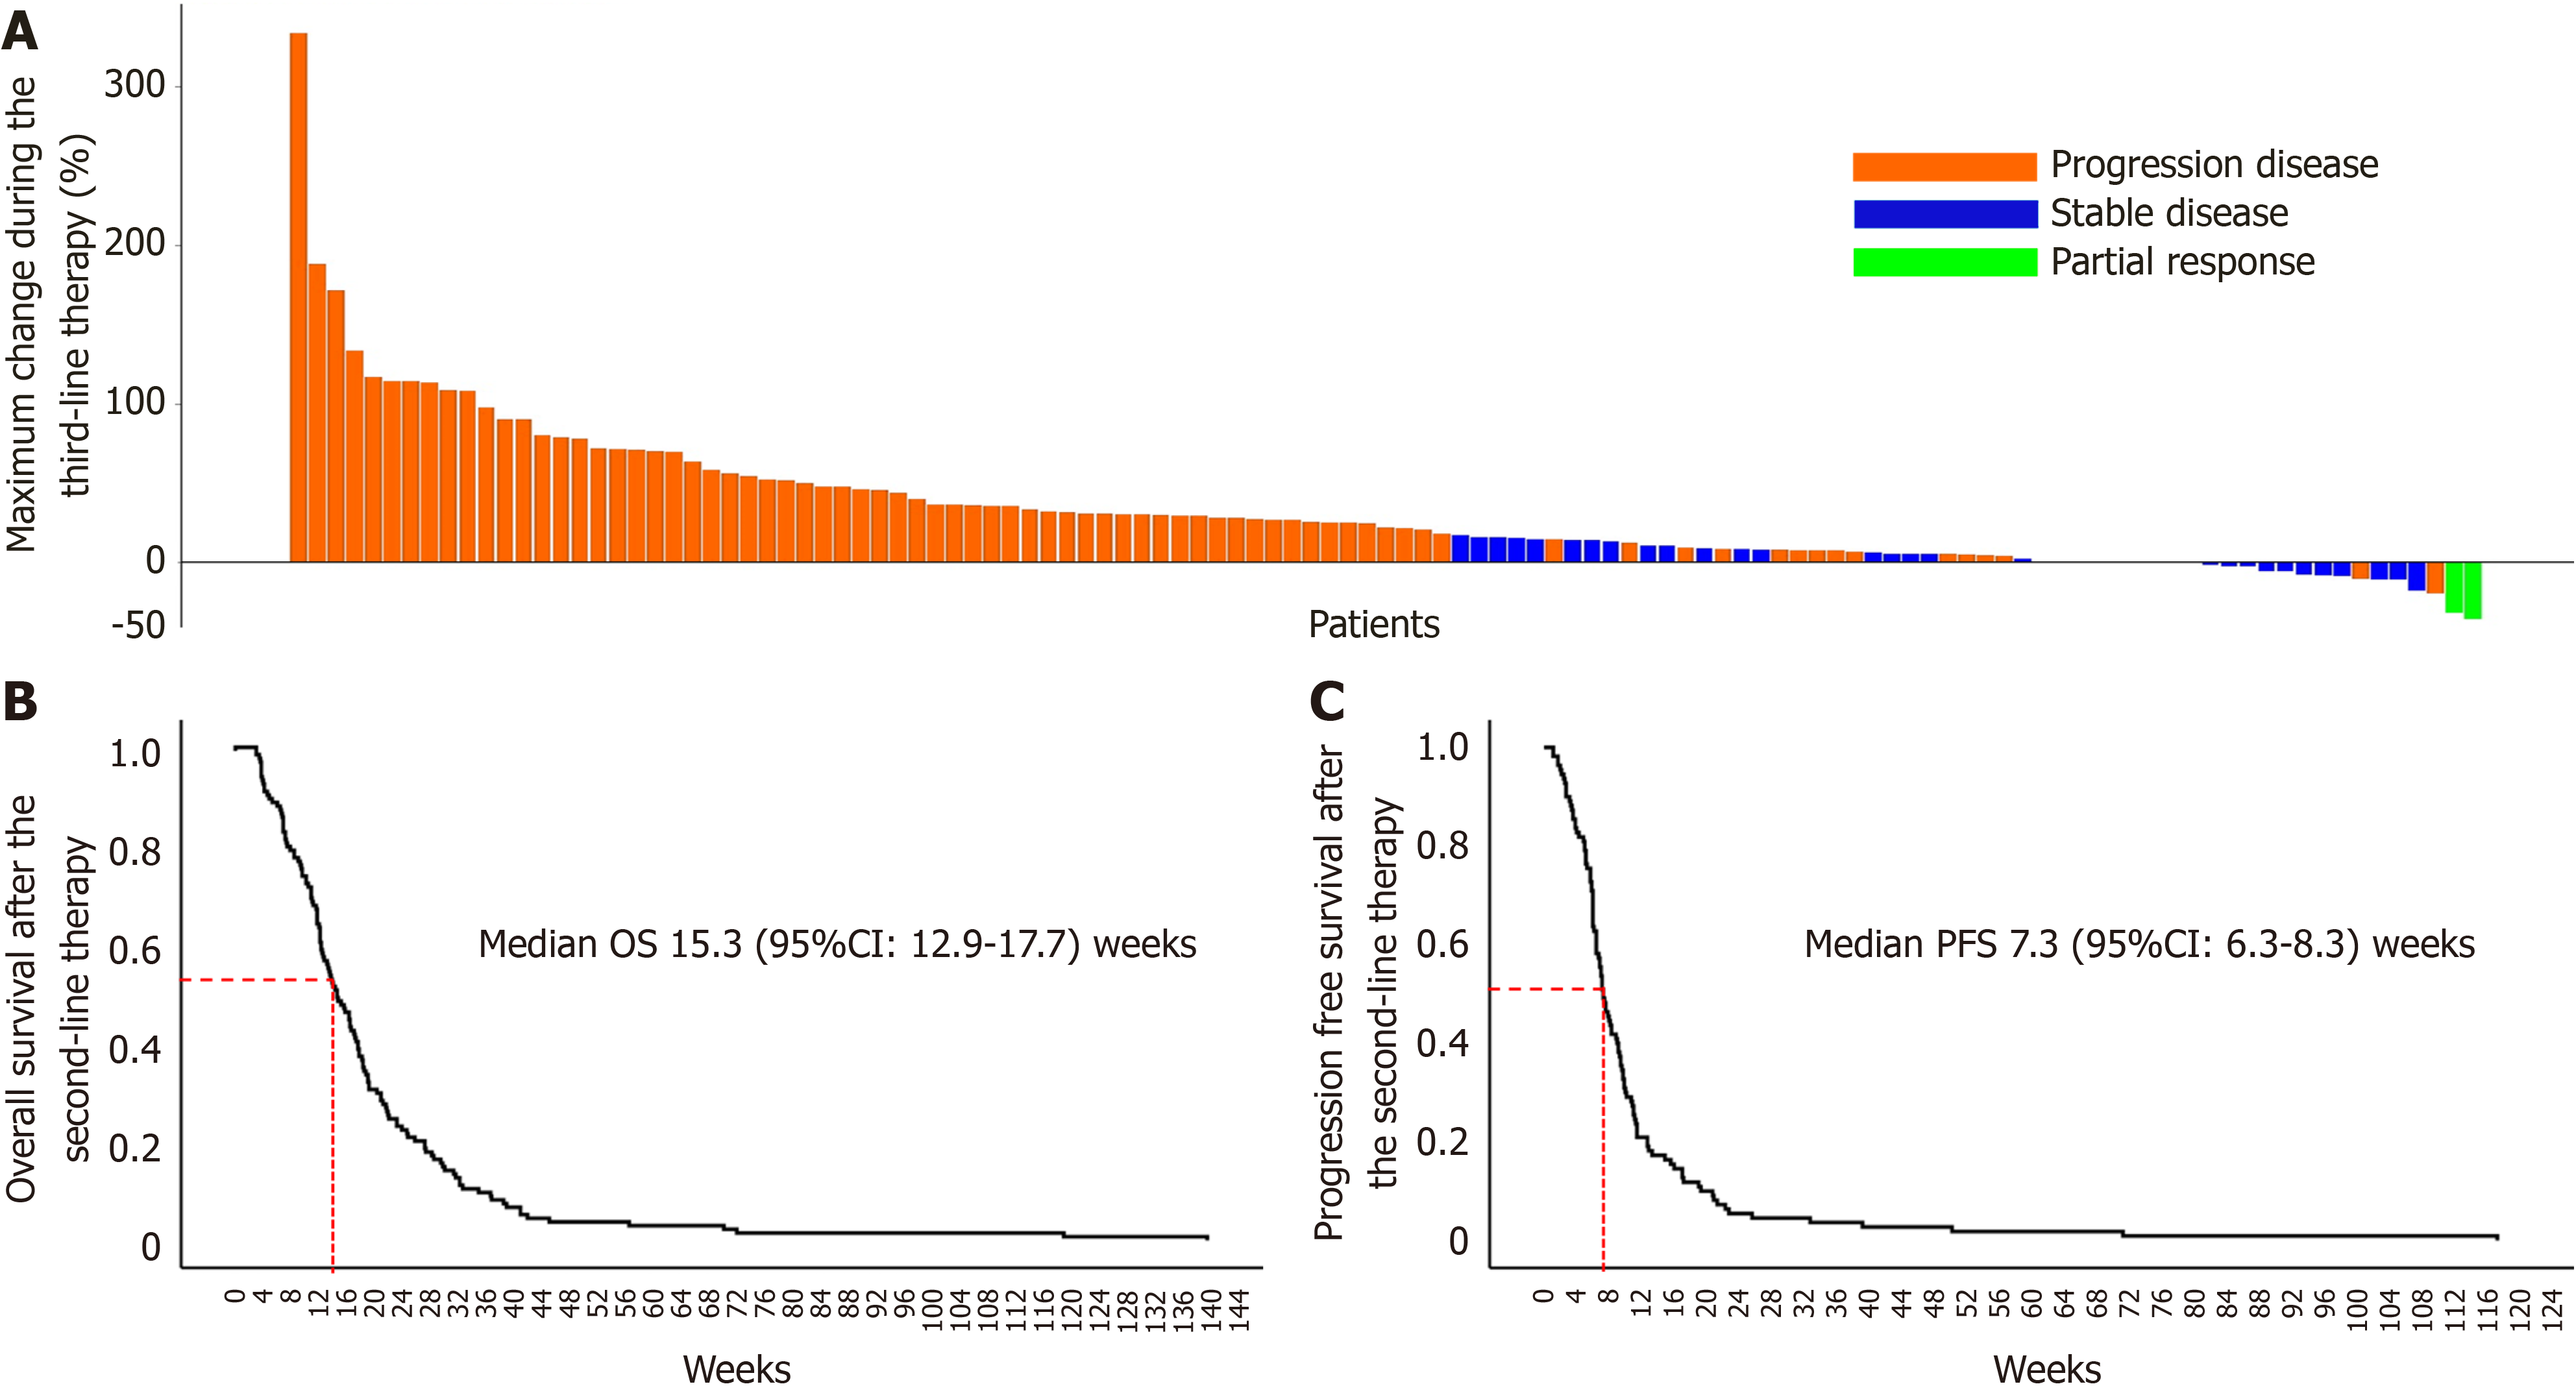
Figure 2 Treatment outcomes of third-line chemotherapy.
A: Waterfall plot illustrating the best tumor response during third-line chemotherapy. The evaluation was based on the response evaluation criteria in solid tumors system, with a disease control rate of 26.2%; B: Kaplan-Meier curve showing a median overall survival of 15.3 weeks during third-line chemotherapy; C: Kaplan-Meier curve showing a median progression-free survival of 7.3 weeks during third-line chemotherapy. OS: Overall survival; CI: Confidence interval; PFS: Progression-free survival.
- Citation: Kim B, Kim J, Yang S, Ahn J, Jung K, Lee JC, Hwang JH. Identification of patients with advanced pancreatic cancer who might benefit from third-line chemotherapy. World J Gastrointest Oncol 2025; 17(2): 100167
- URL: https://www.wjgnet.com/1948-5204/full/v17/i2/100167.htm
- DOI: https://dx.doi.org/10.4251/wjgo.v17.i2.100167


