Copyright
©The Author(s) 2024.
World J Gastrointest Oncol. Sep 15, 2024; 16(9): 3932-3954
Published online Sep 15, 2024. doi: 10.4251/wjgo.v16.i9.3932
Published online Sep 15, 2024. doi: 10.4251/wjgo.v16.i9.3932
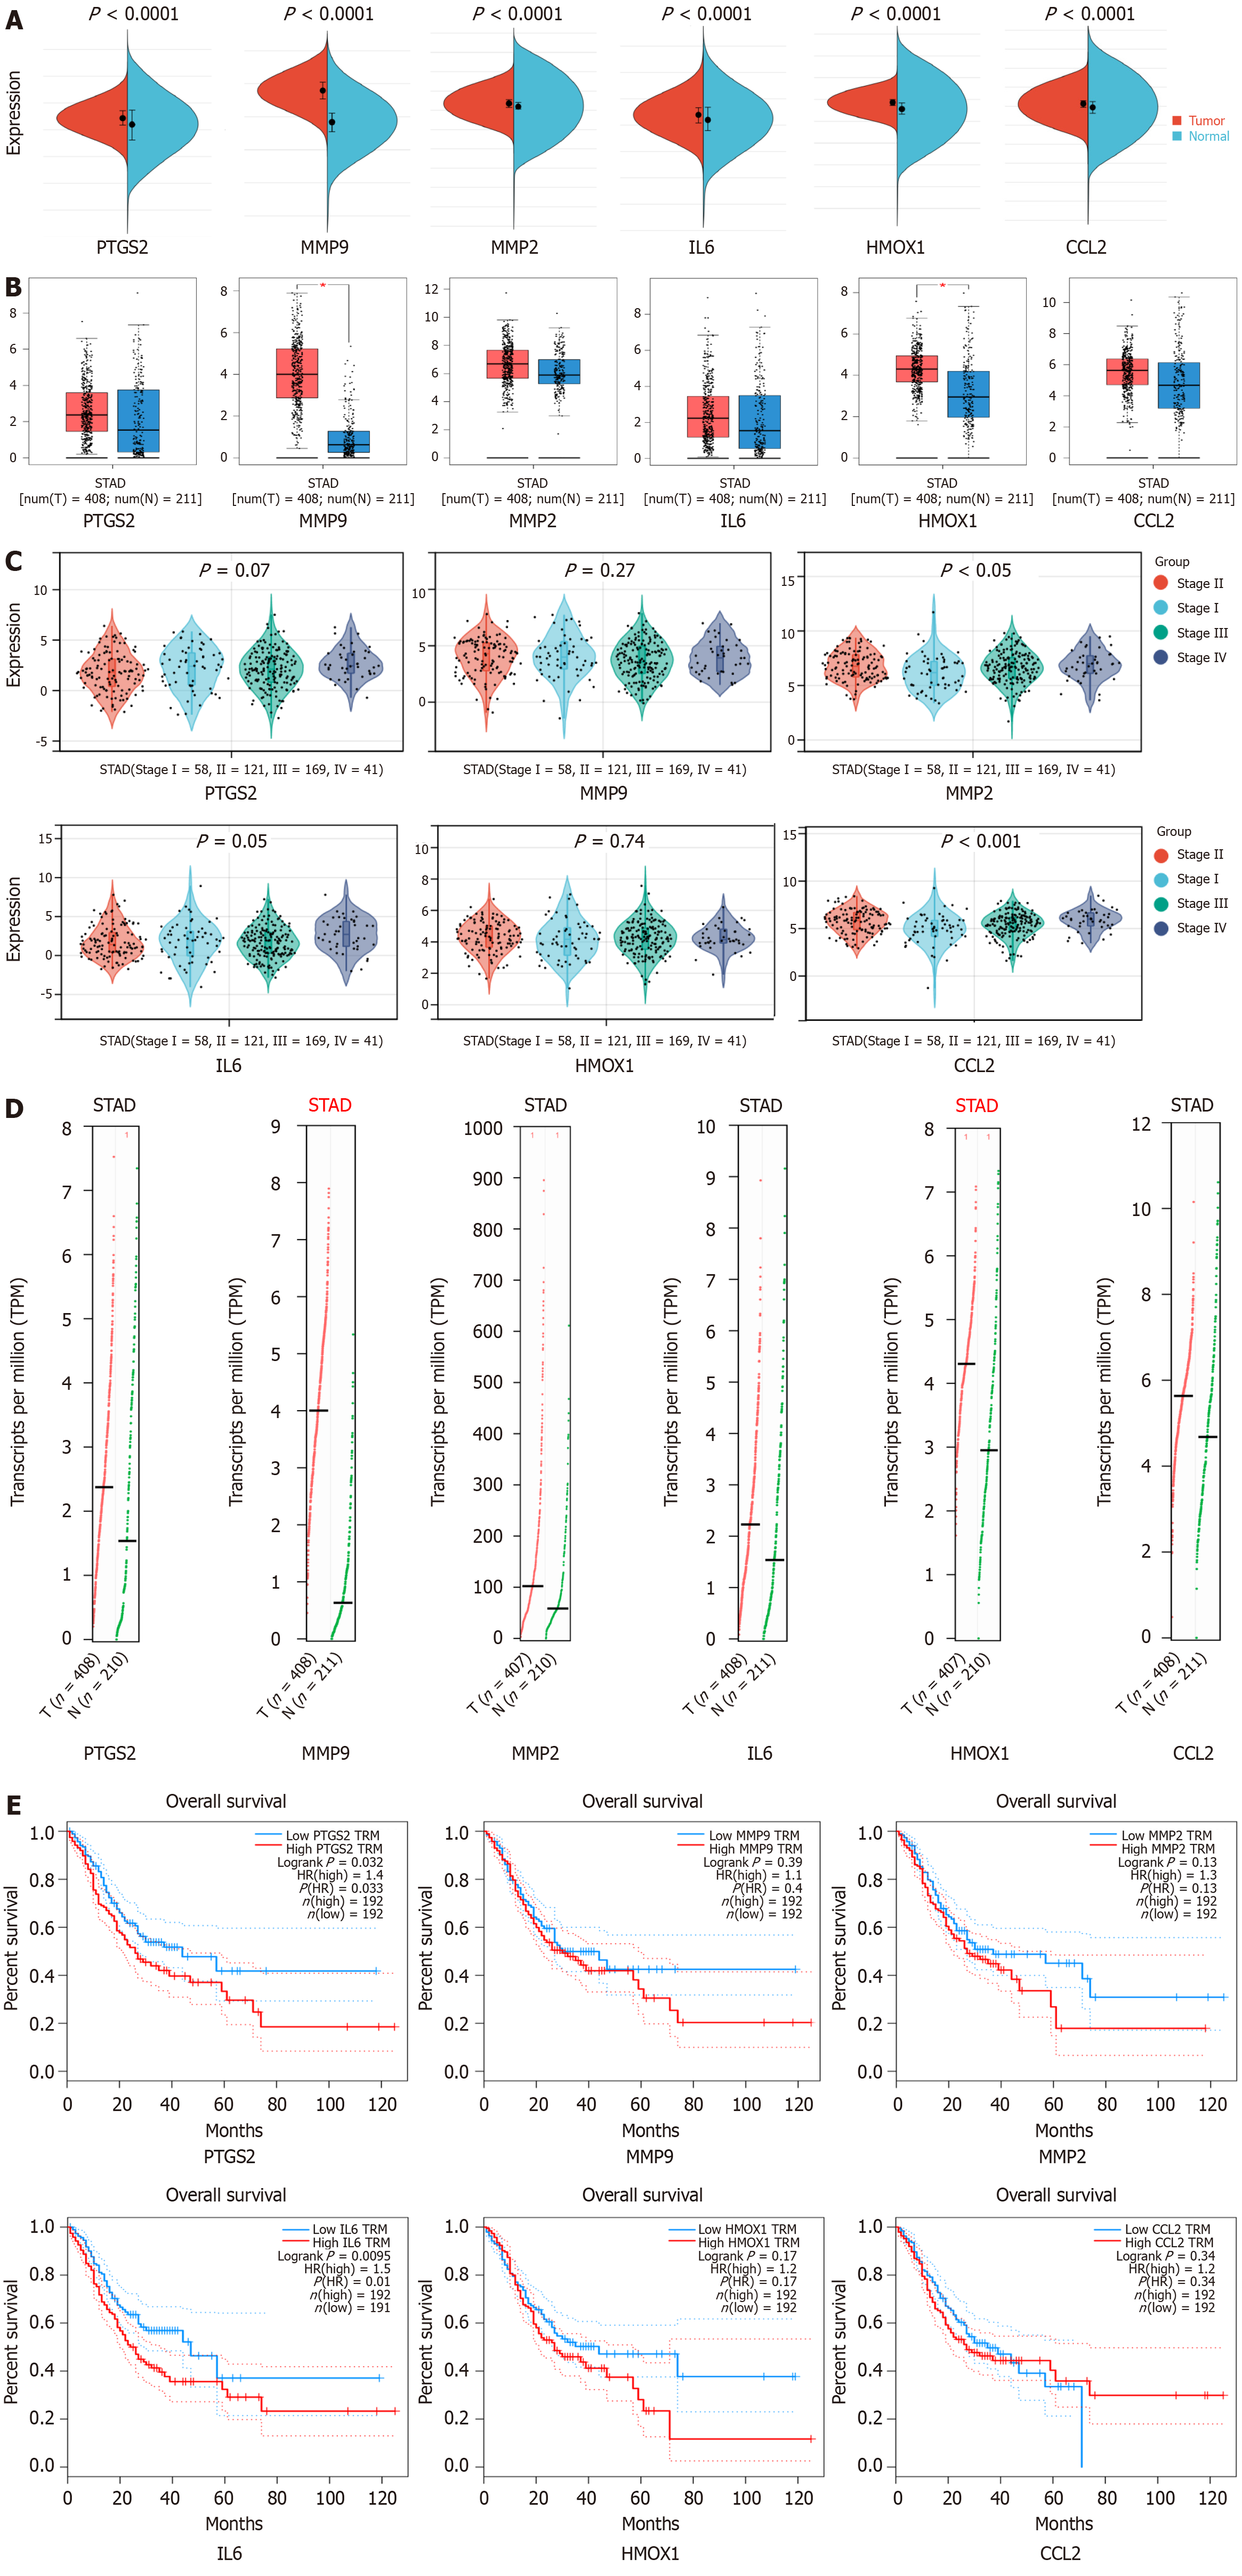
Figure 5 Clinical correlation analysis of hub genes in gastric cancer.
A: Expression levels of hub gene mRNA: Red represents the tumor group and blue represents the normal group; B: Expression levels of hub genes in tumor and normal tissues. Red represents the tumor group and blue represents the normal group; C: Correlation between hub genes and clinical stage of gastric cancer; D: Hub gene copy number. Red represents the tumor group and green represents the normal group; E: Survival analysis of the hub genes in gastric cancer patients.
- Citation: Chen GQ, Nan Y, Ning N, Huang SC, Bai YT, Zhou ZY, Qian G, Li WQ, Yuan L. Network pharmacology study and in vitro experimental validation of Xiaojianzhong decoction against gastric cancer. World J Gastrointest Oncol 2024; 16(9): 3932-3954
- URL: https://www.wjgnet.com/1948-5204/full/v16/i9/3932.htm
- DOI: https://dx.doi.org/10.4251/wjgo.v16.i9.3932


