Copyright
©The Author(s) 2024.
World J Gastrointest Oncol. Sep 15, 2024; 16(9): 3932-3954
Published online Sep 15, 2024. doi: 10.4251/wjgo.v16.i9.3932
Published online Sep 15, 2024. doi: 10.4251/wjgo.v16.i9.3932
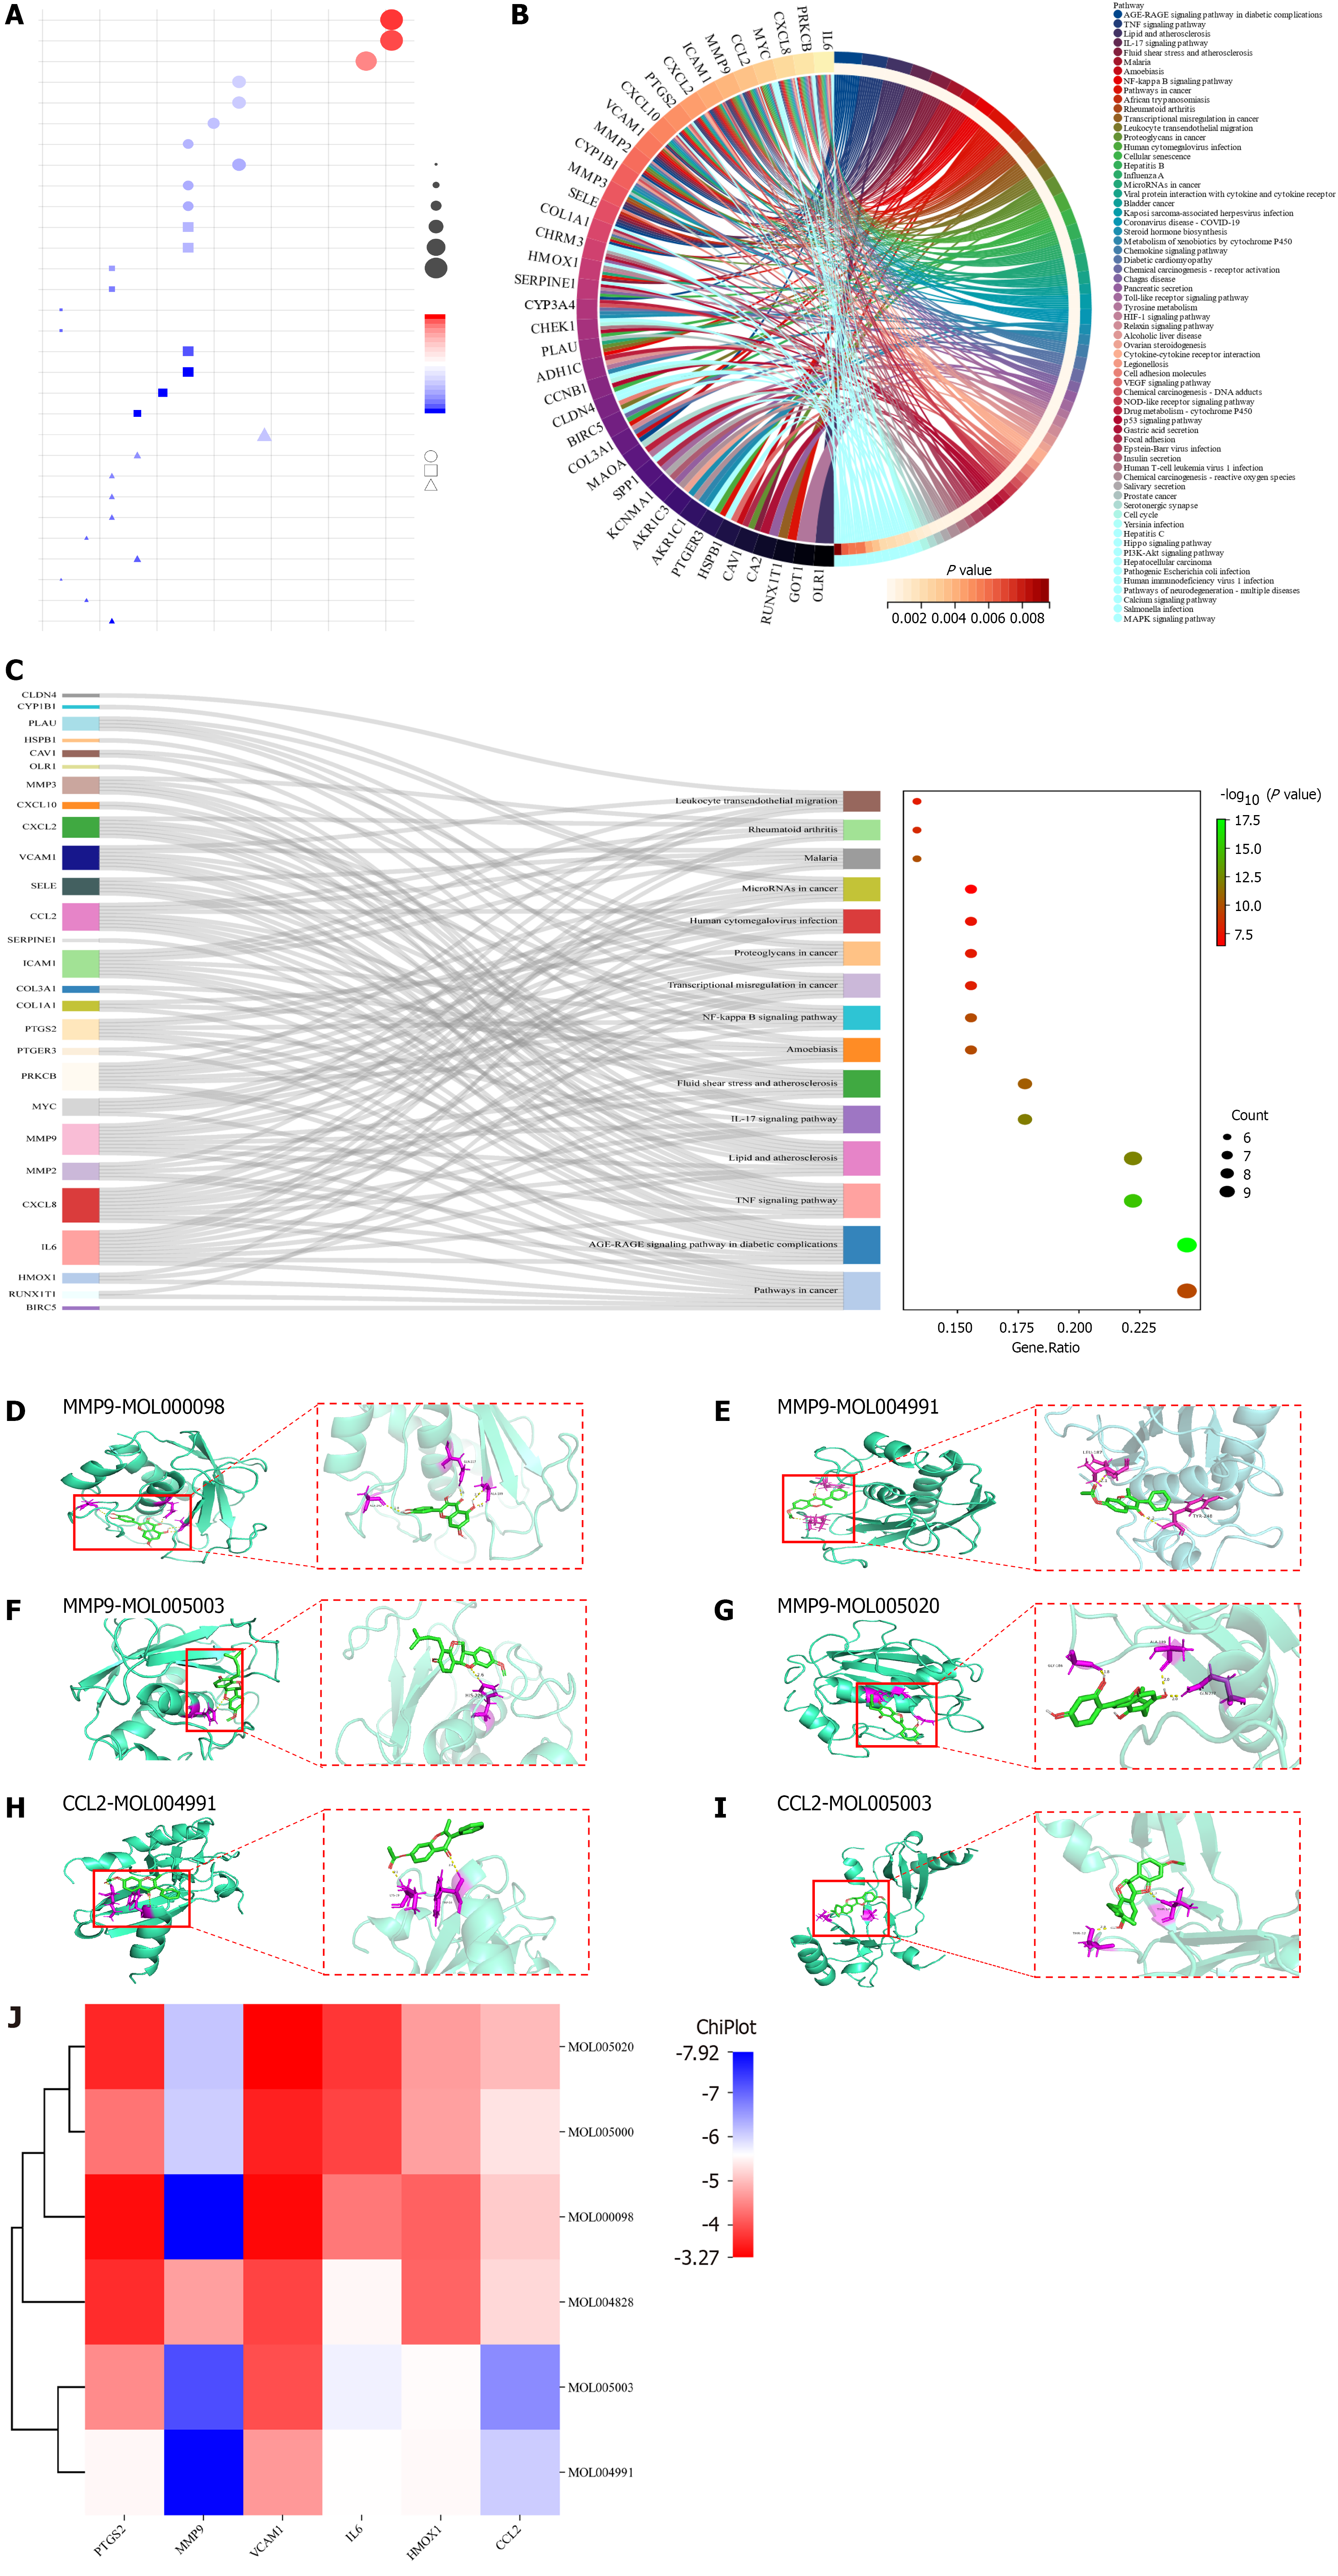
Figure 4 Enrichment analysis of core targets and molecular docking.
A: Gene ontology analysis of intersecting genes. Circles, squares, and triangles denote biological processes, cellular compositions, and molecular functions, respectively. The size of the shape indicates the number of targets enriched; the larger the shape, the more the enriched targets. The redder the color, the more significant the enriched pathway; B: Kyoto encyclopedia of genes and genomes (KEGG) circle diagram of intersecting targets. The outermost left side of the circle represents the intersection target, the outermost right side color represents the pathway, and the color of the innermost right side of the circle represents the P value of the enriched pathway; the lighter the color, the more significant the enriched pathway; C: Ranking of the front KEGG Sankey diagram. The left side represents the intersection target, the middle side represents the pathway, the curve indicates the correlation between the two, and the rightmost bubble graph represents the result of KEGG enrichment; the larger the circle, the redder the color, the more significant the enriched pathway; D-I: Visual demonstration of partial molecular docking; D-G: Molecular docking of MMP9 with quercetin, 7-acetoxy-2-methylisoflavone, licoagrocarpin, and dehydroglyasperins C; H and I: Molecular docking of CCL2 with 7-acetoxy-2-methylisoflavone and licoagrocarpin; J: Heat map of molecular docking binding energy of core genes and core active ingredients.
- Citation: Chen GQ, Nan Y, Ning N, Huang SC, Bai YT, Zhou ZY, Qian G, Li WQ, Yuan L. Network pharmacology study and in vitro experimental validation of Xiaojianzhong decoction against gastric cancer. World J Gastrointest Oncol 2024; 16(9): 3932-3954
- URL: https://www.wjgnet.com/1948-5204/full/v16/i9/3932.htm
- DOI: https://dx.doi.org/10.4251/wjgo.v16.i9.3932


