Copyright
©The Author(s) 2024.
World J Gastrointest Oncol. Sep 15, 2024; 16(9): 3913-3931
Published online Sep 15, 2024. doi: 10.4251/wjgo.v16.i9.3913
Published online Sep 15, 2024. doi: 10.4251/wjgo.v16.i9.3913
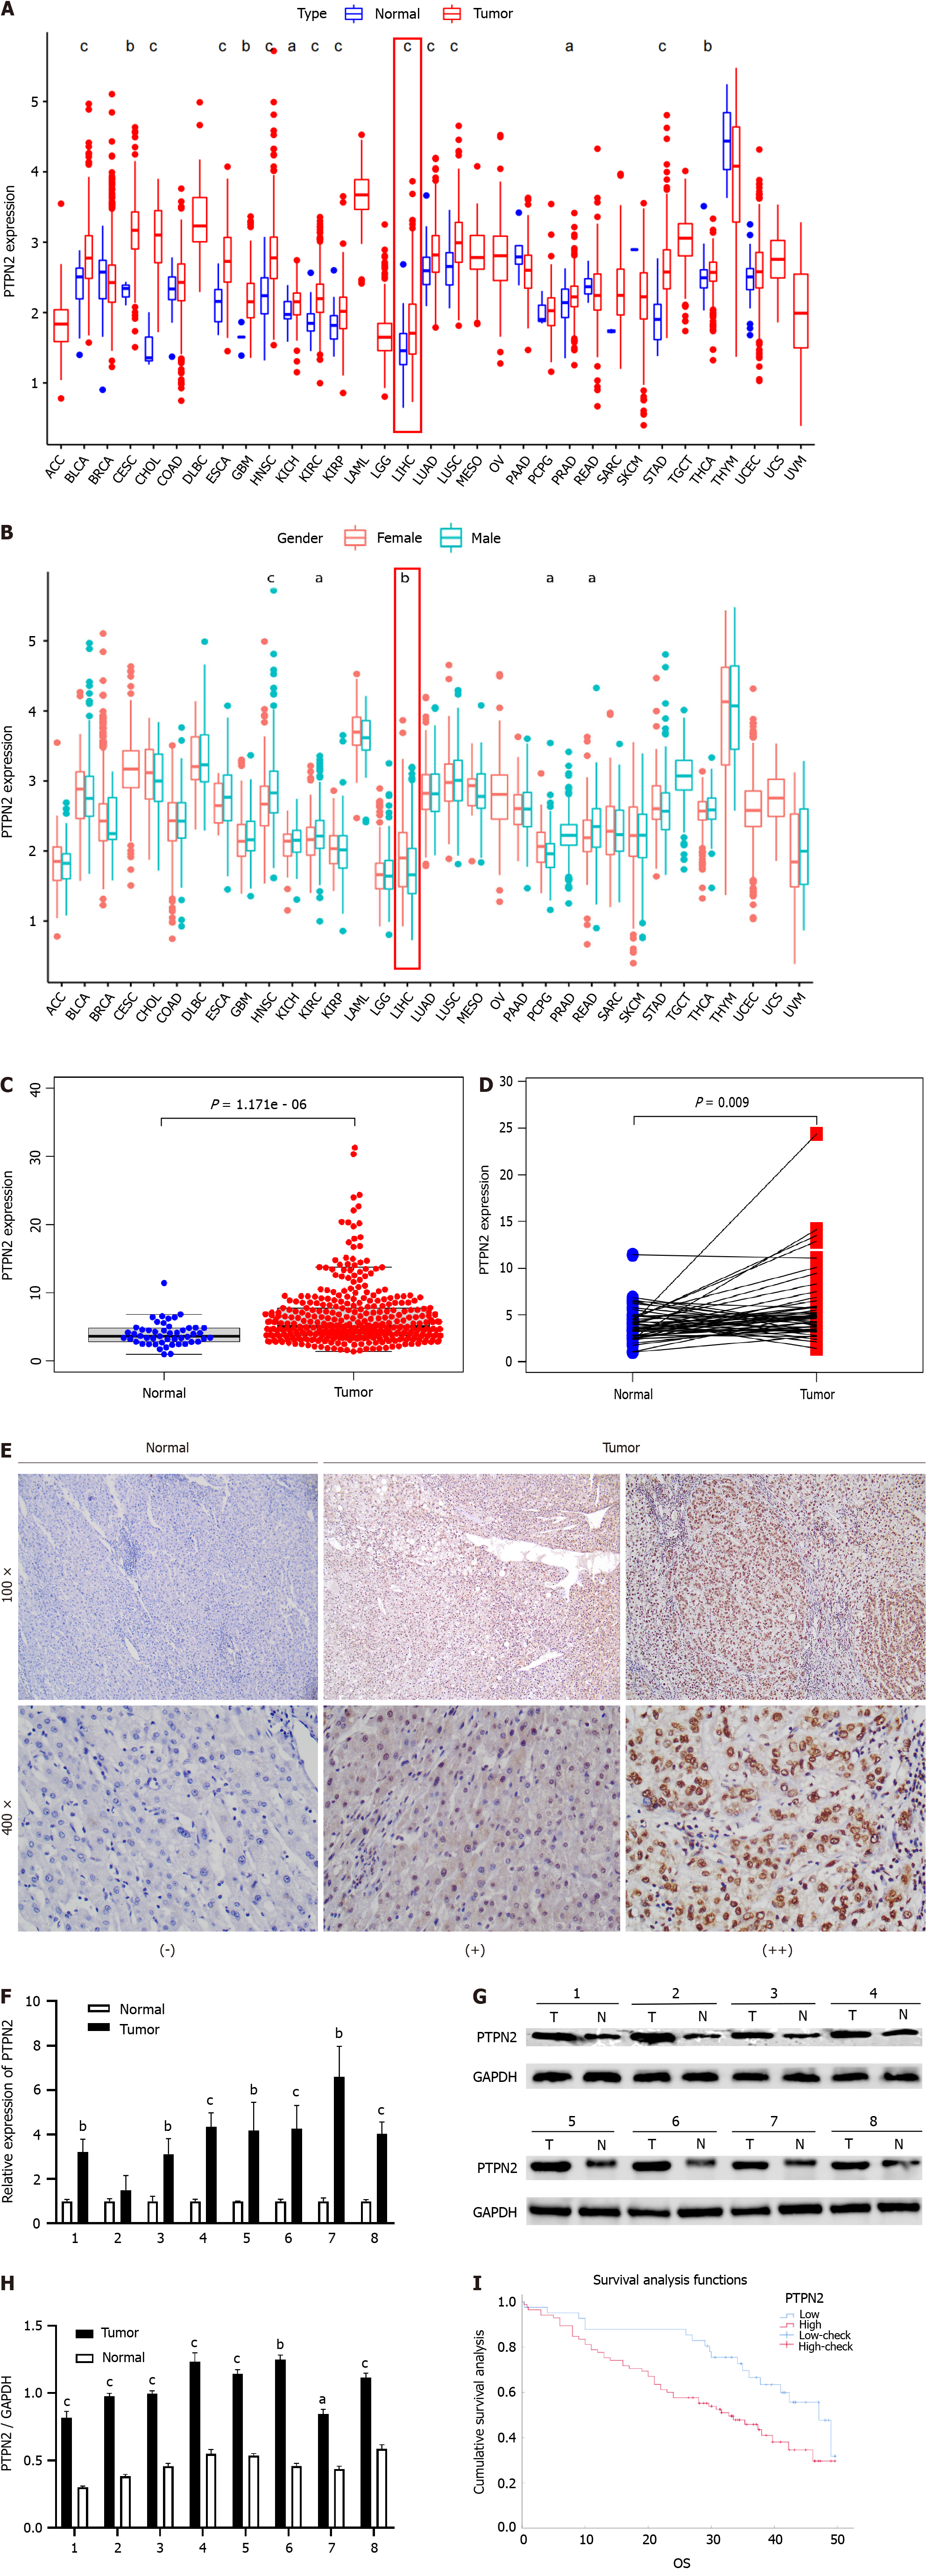
Figure 1 Expression levels of protein tyrosine phosphatase non-receptor 2 in tumors.
A: Differences in protein tyrosine phosphatase non-receptor 2 (PTPN2) expression in tumor and normal tissues in pan-tumor species in The Cancer Genome Atlas (TCGA) database; B: Correlation of PTPN2 expression with patient sex; C and D: Unpaired and paired significance analysis of PTPN2 expression in the TCGA database; E: Immunohistochemical analysis of 126 pairs of paraffin-embedded HCC tissues and adjacent normal tissues showing higher PTPN2 expression in the HCC tissues; F: Results of quantitative real-time polymerase chain reaction analysis of PTPN2 mRNA expression in eight pairs of HCC tissues and corresponding normal tissues; G: Western blot analysis comparing the protein expression of PTPN2 in eight pairs of HCC tissues and normal tissues and quantitative analysis of significance; H: Quantitative analysis of the results of Western blot to compare tumor tissues and normal tissues; I: Kaplan-Meier survival analysis based on PTPN2 expression in 126 hepatocellular carcinoma (HCC) patients. aP < 0.05; bP < 0.01; cP < 0.001. PTPN2: Protein tyrosine phosphatase non-receptor 2; OS: Overall survival.
- Citation: Li HY, Jing YM, Shen X, Tang MY, Shen HH, Li XW, Wang ZS, Su F. Protein tyrosine phosphatase non-receptor II: A possible biomarker of poor prognosis and mediator of immune evasion in hepatocellular carcinoma. World J Gastrointest Oncol 2024; 16(9): 3913-3931
- URL: https://www.wjgnet.com/1948-5204/full/v16/i9/3913.htm
- DOI: https://dx.doi.org/10.4251/wjgo.v16.i9.3913


