Copyright
©The Author(s) 2024.
World J Gastrointest Oncol. Sep 15, 2024; 16(9): 3865-3874
Published online Sep 15, 2024. doi: 10.4251/wjgo.v16.i9.3865
Published online Sep 15, 2024. doi: 10.4251/wjgo.v16.i9.3865
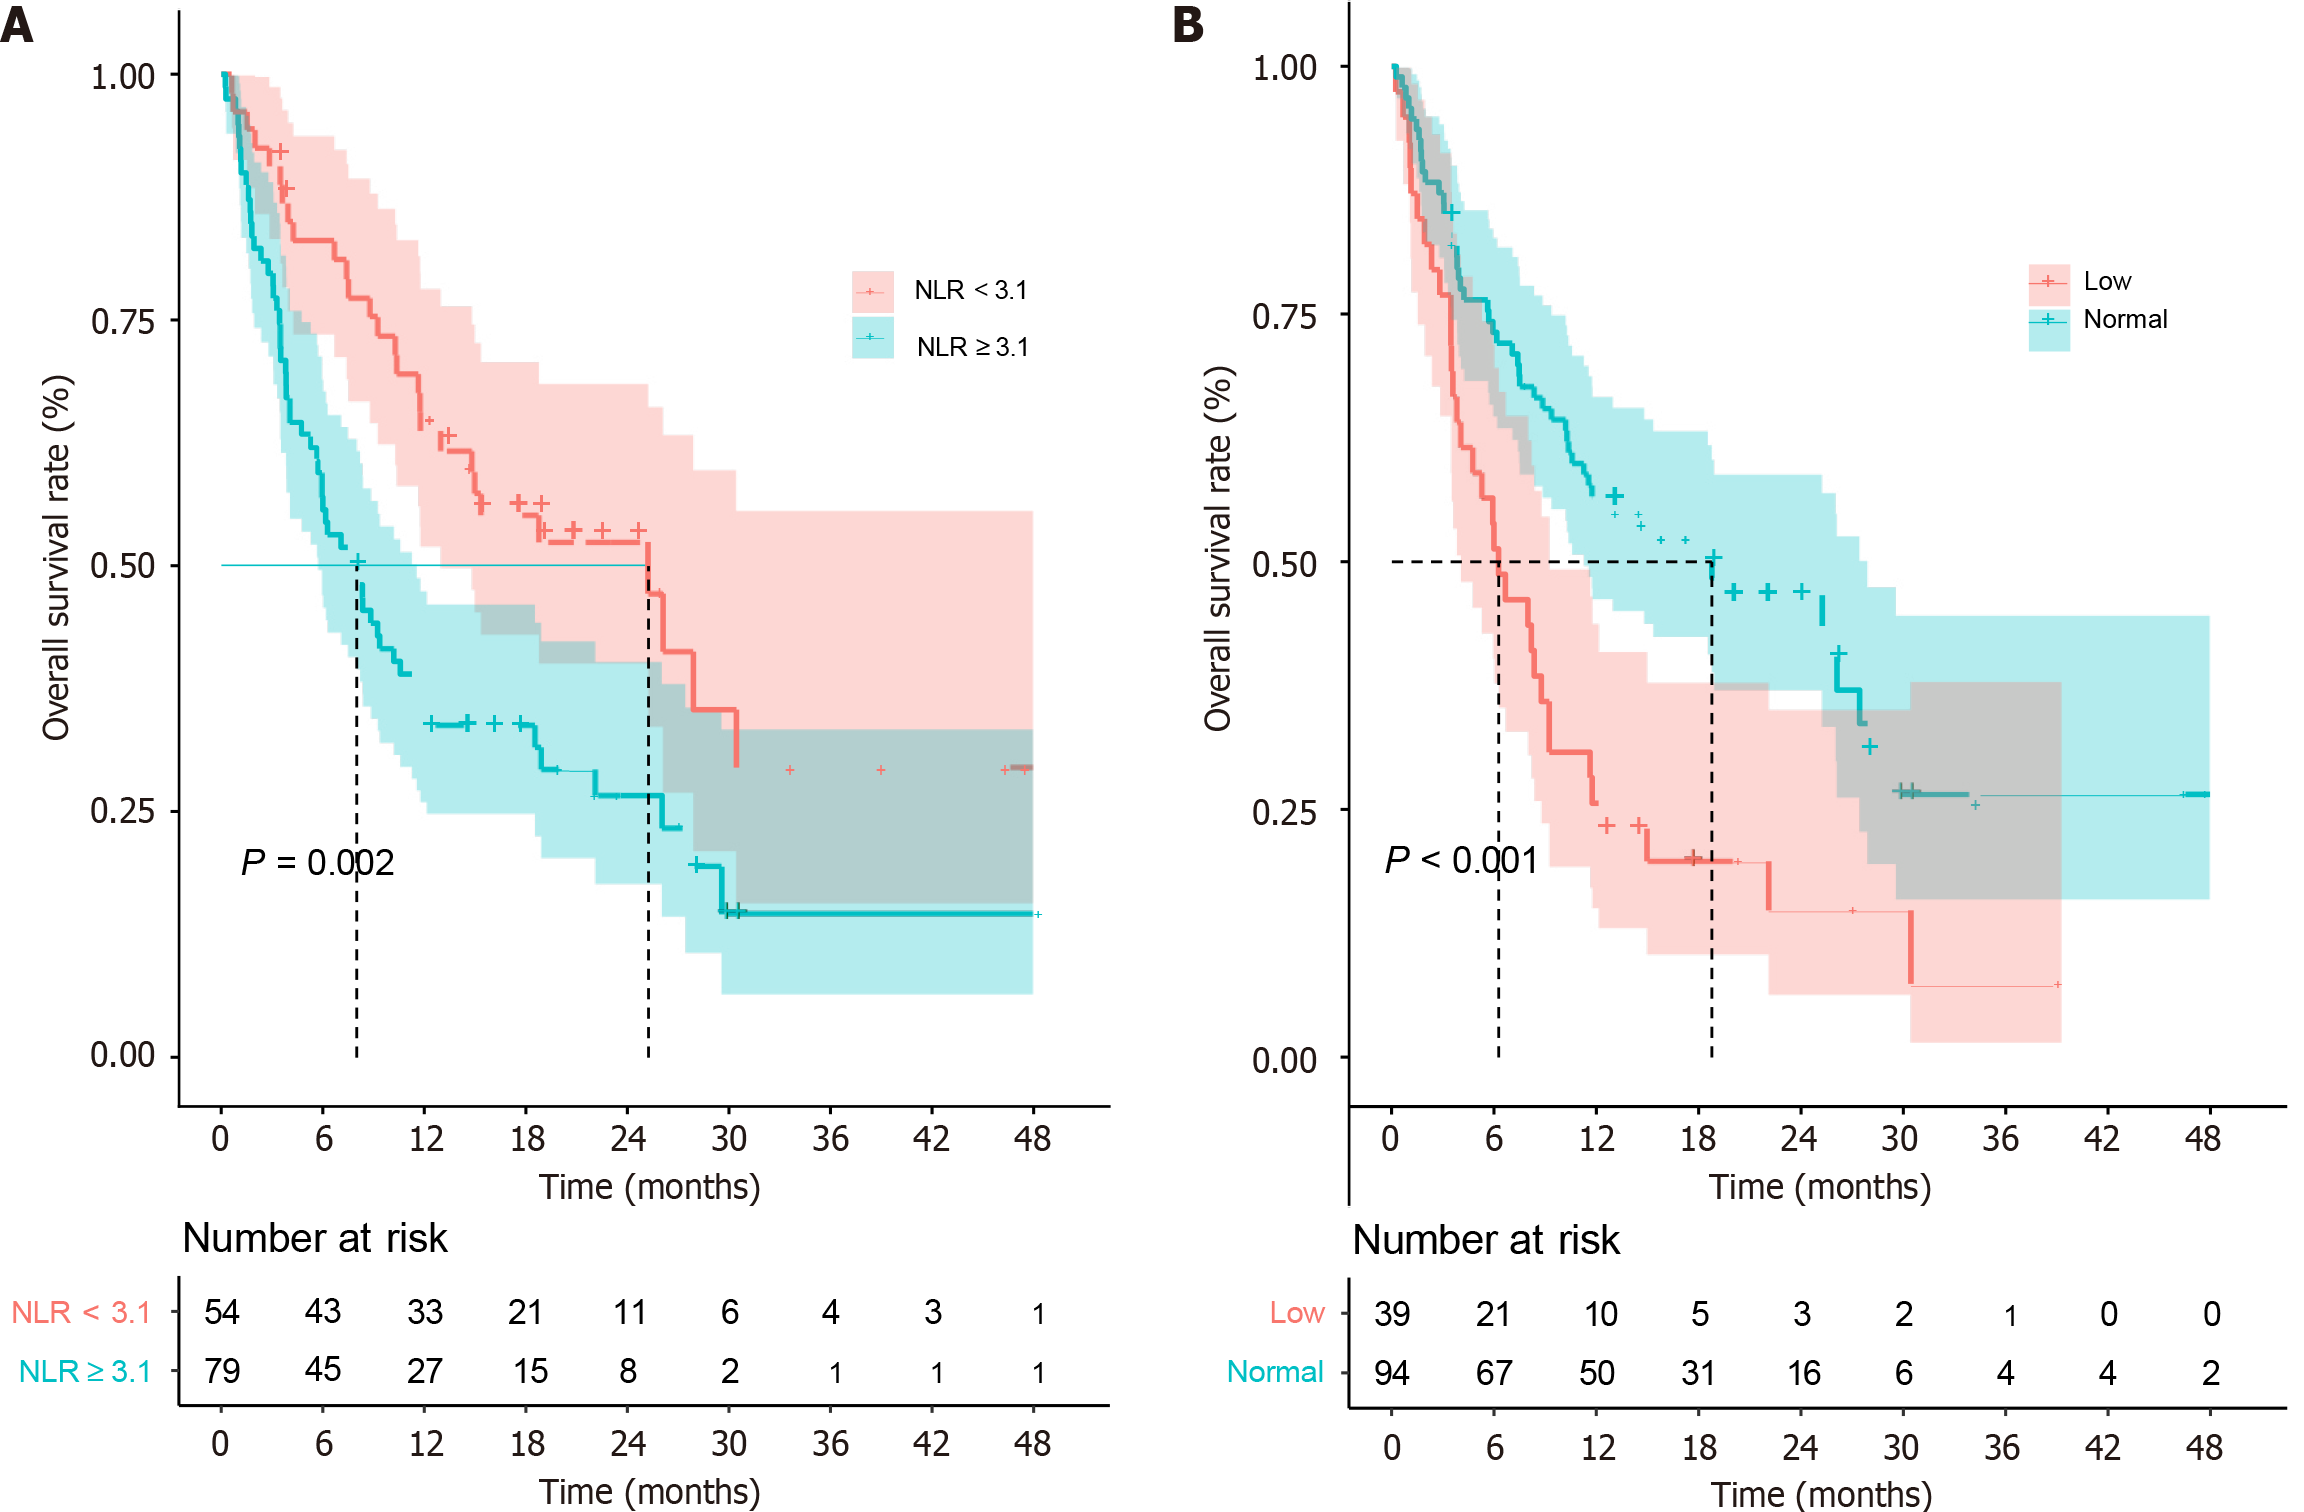
Figure 1 Kaplan-Meier curve for patients with high and low neutrophil-to-lymphocyte ratio, normal and low hemoglobin levels.
A: Kaplan-Meier curve for patients with high and low neutrophil-to-lymphocyte ratio; B: Kaplan-Meier curve for patients with normal and low hemoglobin levels. NLR: Neutrophil-to-lymphocyte ratio.
- Citation: Wu ZJ, Lan B, Luo J, Ameti A, Wang H, Hu QY. Impact of preoperative inflammatory and nutritional markers on the prognosis of patients with peritoneal metastasis of colorectal cancer. World J Gastrointest Oncol 2024; 16(9): 3865-3874
- URL: https://www.wjgnet.com/1948-5204/full/v16/i9/3865.htm
- DOI: https://dx.doi.org/10.4251/wjgo.v16.i9.3865


