Copyright
©The Author(s) 2024.
World J Gastrointest Oncol. Aug 15, 2024; 16(8): 3705-3715
Published online Aug 15, 2024. doi: 10.4251/wjgo.v16.i8.3705
Published online Aug 15, 2024. doi: 10.4251/wjgo.v16.i8.3705
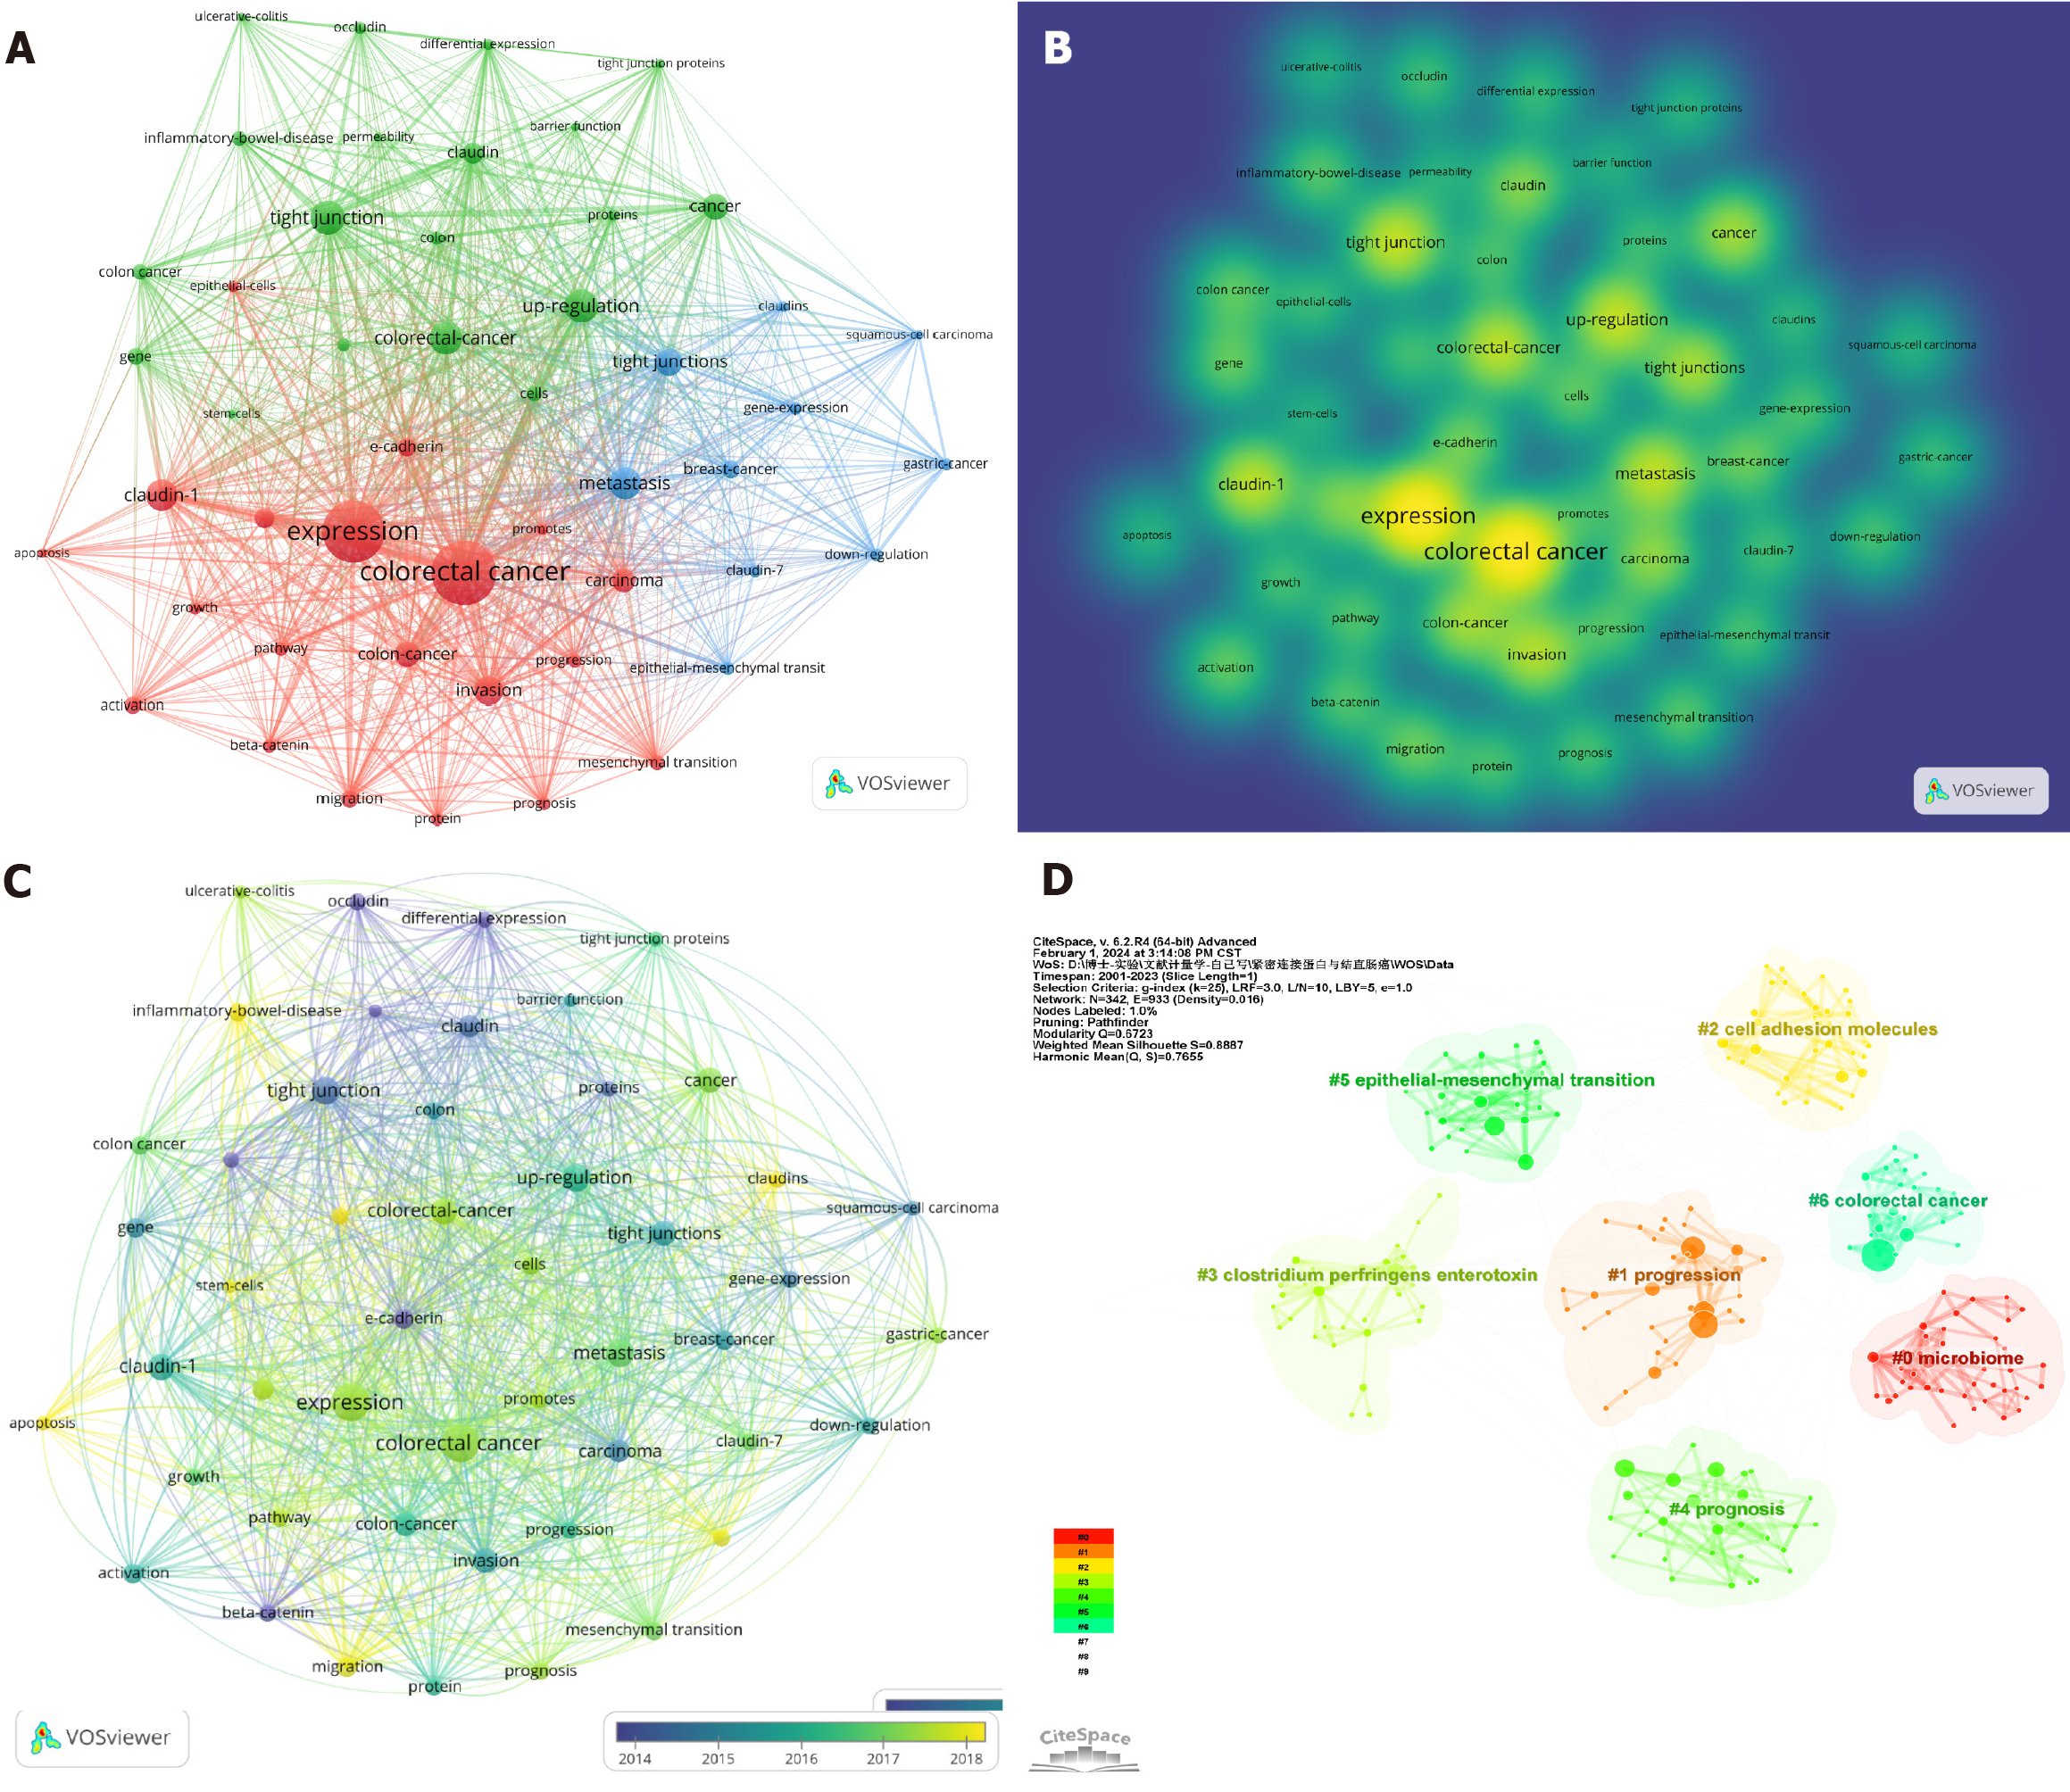
Figure 5 Visualization of keywords related to tight junctions and colorectal cancer research from 2001 to 2023.
A: The cooperation network of keywords in the field. Dots represent keywords, with larger dots indicating a greater frequency of keywords. Clusters are marked using different colors, and links represent co-occurrence between keywords; B: The density of keywords in the field; C: Temporal view of keyword co-occurrence analysis (the node color represents the average year of keyword occurrence); D: Keyword clustering analysis in this field. Different colors represent different clusters. Each point represents a keyword, and the number on the node represents the cluster to which the keyword belongs. The different patterns represented a cluster. Tag# was allocated to clusters; the smaller the count was, the greater the number of keywords in the cluster.
- Citation: Li HM, Liu Y, Hao MD, Liang XQ, Yuan DJ, Huang WB, Li WJ, Ding L. Research status and hotspots of tight junctions and colorectal cancer: A bibliometric and visualization analysis. World J Gastrointest Oncol 2024; 16(8): 3705-3715
- URL: https://www.wjgnet.com/1948-5204/full/v16/i8/3705.htm
- DOI: https://dx.doi.org/10.4251/wjgo.v16.i8.3705


