Copyright
©The Author(s) 2024.
World J Gastrointest Oncol. Aug 15, 2024; 16(8): 3687-3704
Published online Aug 15, 2024. doi: 10.4251/wjgo.v16.i8.3687
Published online Aug 15, 2024. doi: 10.4251/wjgo.v16.i8.3687
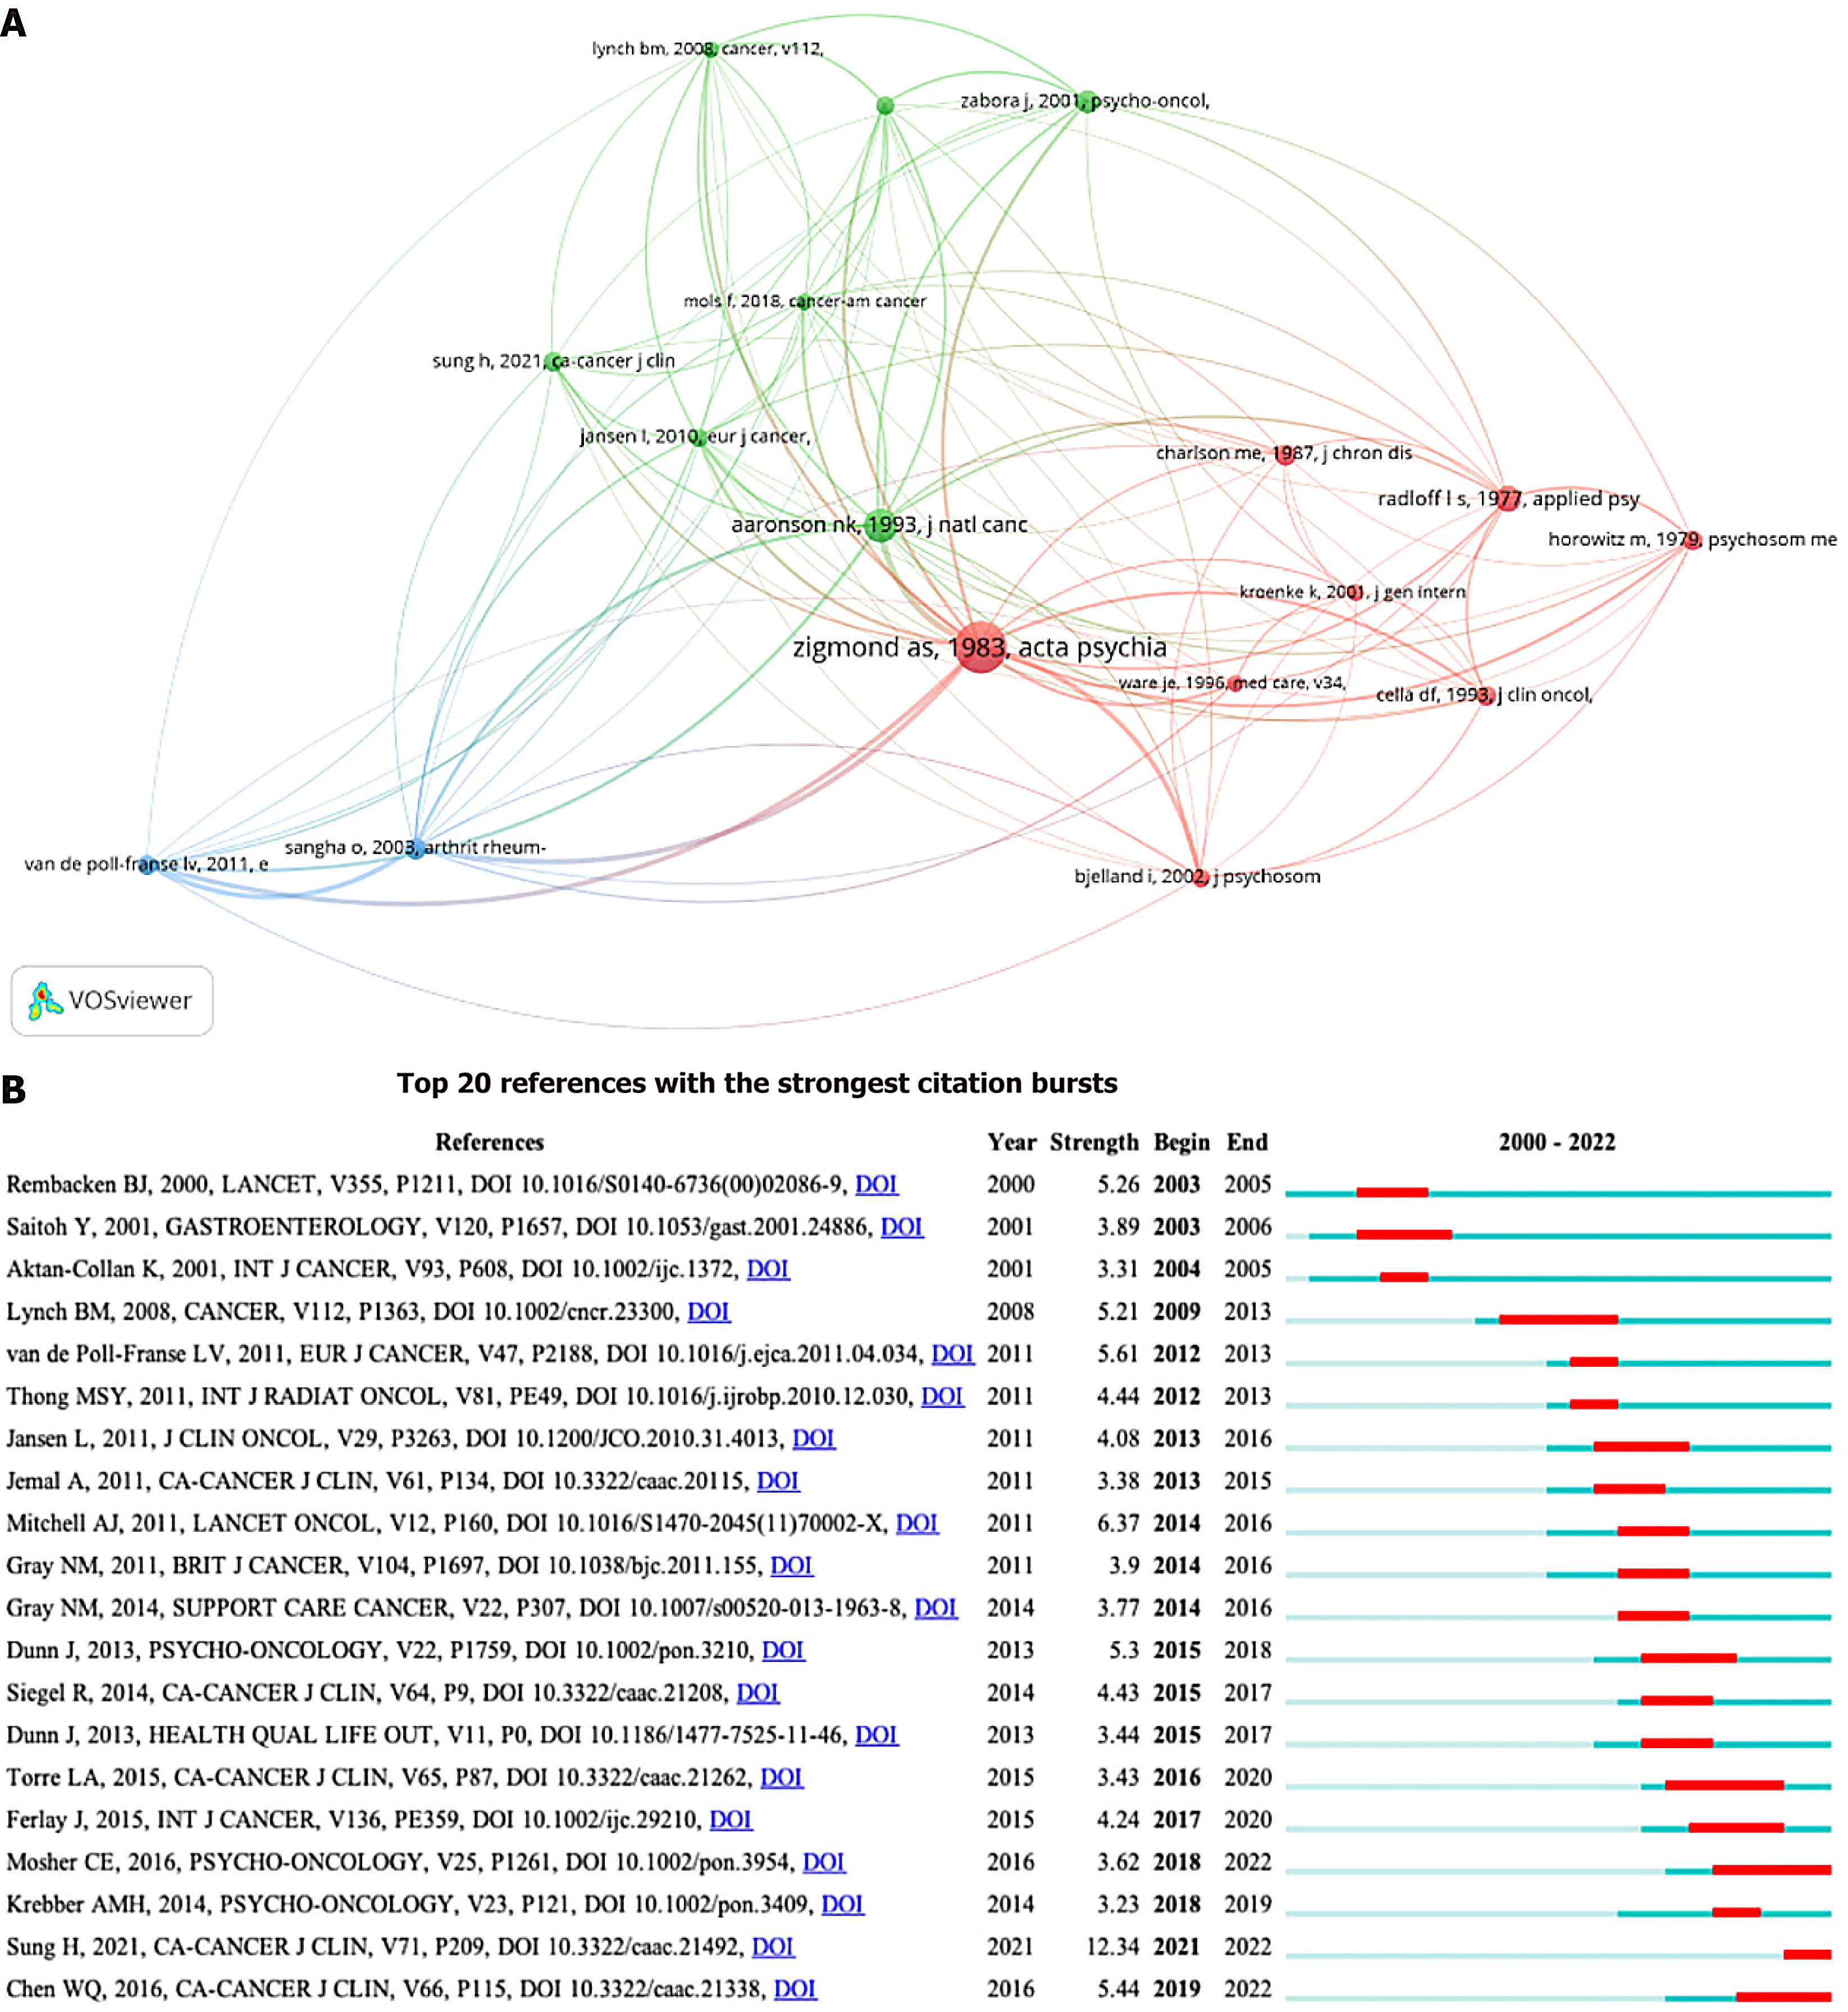
Figure 6 Cluster map of references.
A: VOSviewer visualization map of the co-citation network of references. The cooperative network consists of 12 articles divided into four clusters represented by different colors. The node size indicates the number of citations, and the connecting line indicates a cooperative relationship between the two articles; B: CiteSpace visualization map of top 30 references with strongest citation bursts. Red bars indicate references that were cited frequently in a certain period.
- Citation: Yan ZW, Liu YN, Xu Q, Yuan Y. Current trends and hotspots of depressive disorders with colorectal cancer: A bibliometric and visual study. World J Gastrointest Oncol 2024; 16(8): 3687-3704
- URL: https://www.wjgnet.com/1948-5204/full/v16/i8/3687.htm
- DOI: https://dx.doi.org/10.4251/wjgo.v16.i8.3687


