Copyright
©The Author(s) 2024.
World J Gastrointest Oncol. Aug 15, 2024; 16(8): 3687-3704
Published online Aug 15, 2024. doi: 10.4251/wjgo.v16.i8.3687
Published online Aug 15, 2024. doi: 10.4251/wjgo.v16.i8.3687
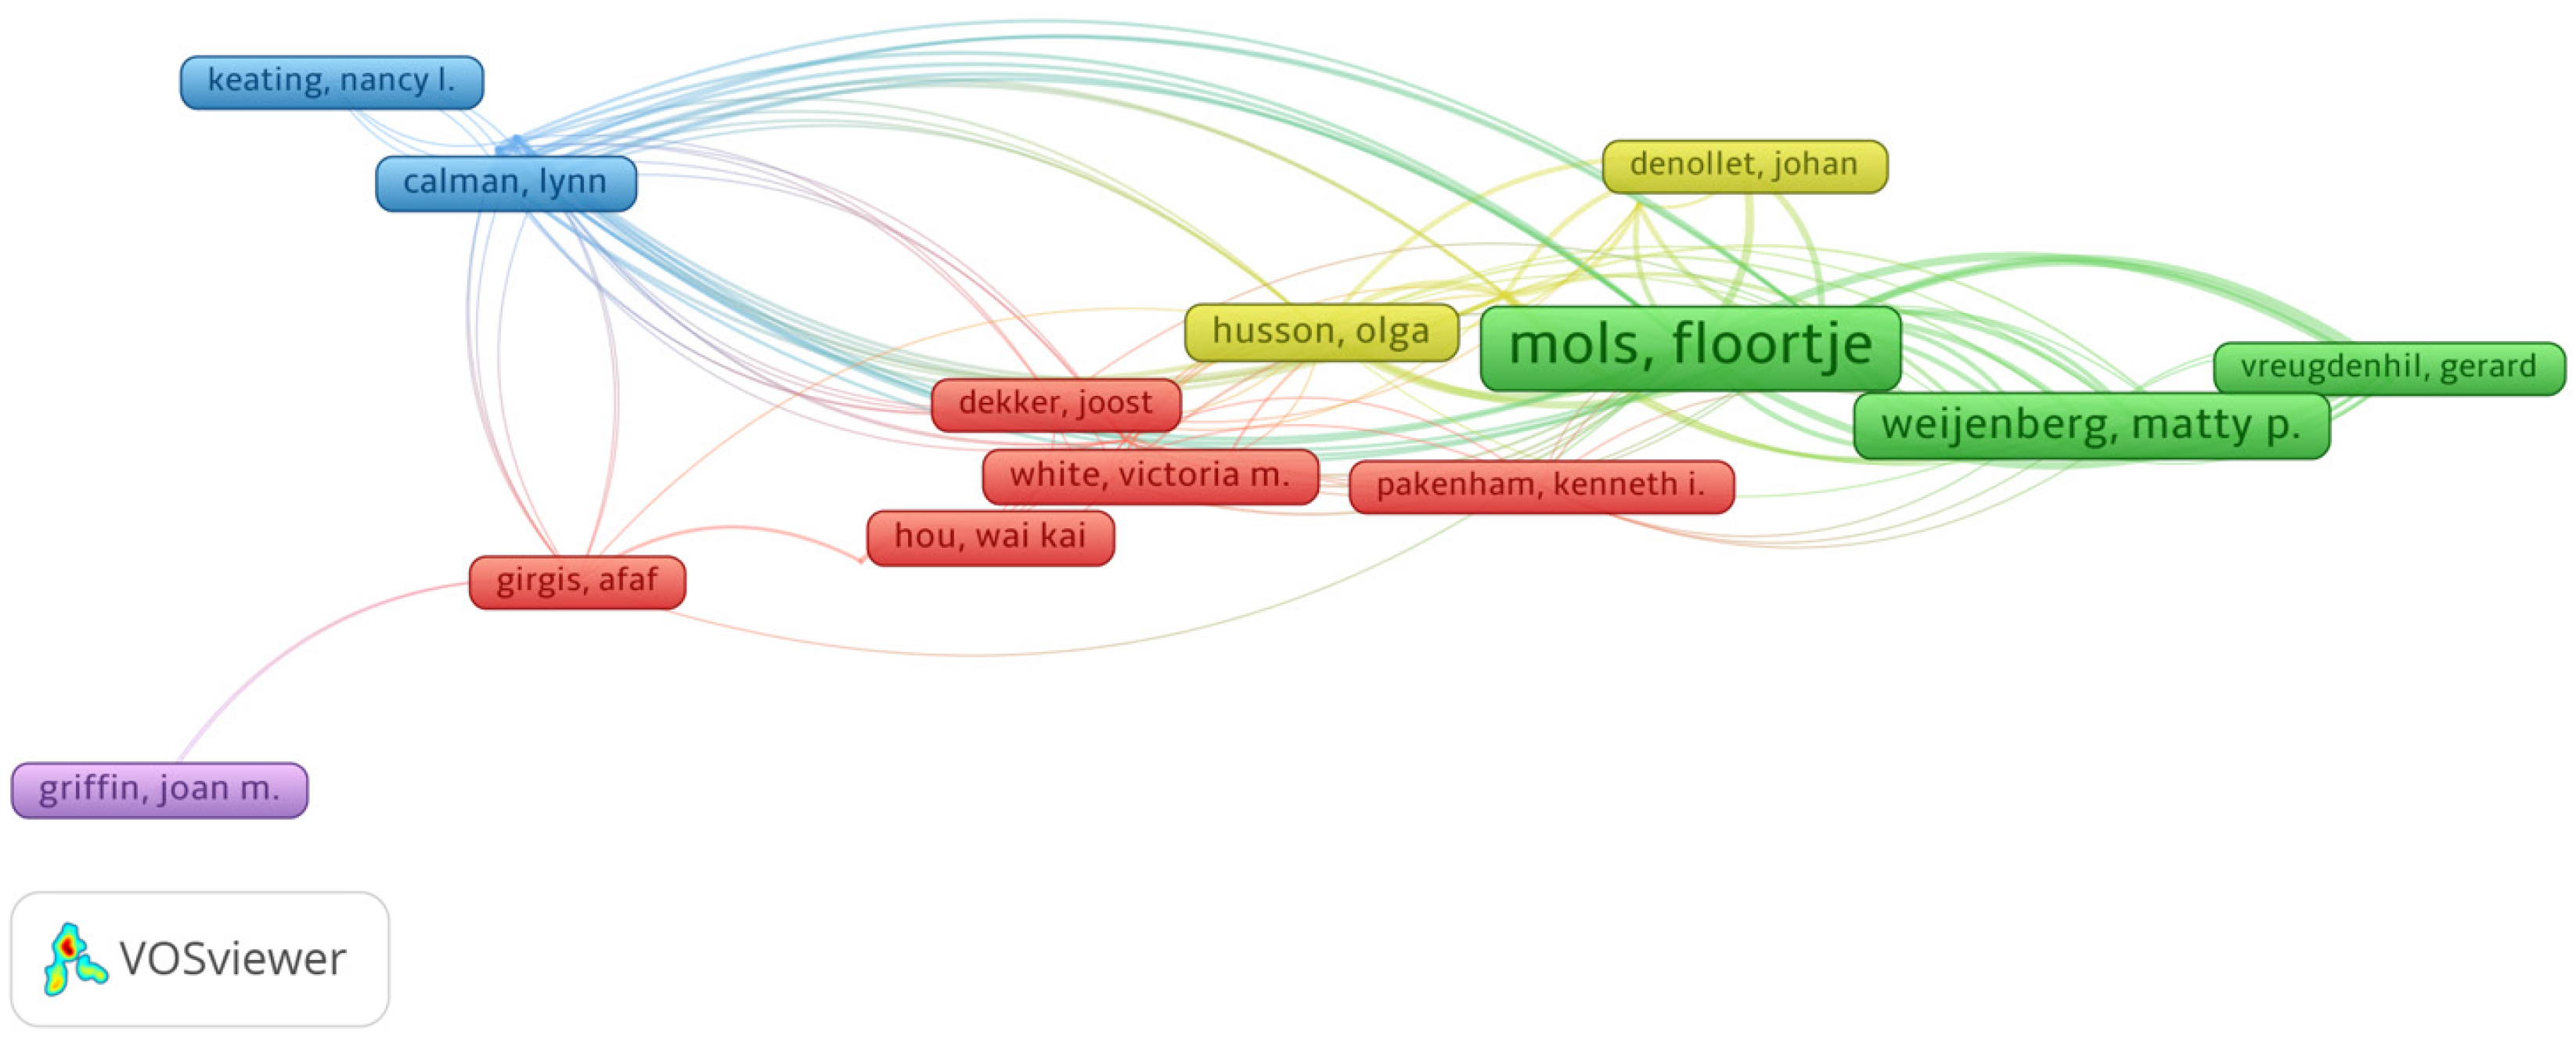
Figure 5 VOSviewer visualization map of the co-authorship network.
Cluster maps of the authors who appeared at least three times. Visualization map of publications of 199 authors forming five collaborating clusters (nodes with the same color). A node represents an author, the size of the node represents the number of publications, a link shows collaboration, and the distance and the thickness of the link between nodes show the relative strength of the relation.
- Citation: Yan ZW, Liu YN, Xu Q, Yuan Y. Current trends and hotspots of depressive disorders with colorectal cancer: A bibliometric and visual study. World J Gastrointest Oncol 2024; 16(8): 3687-3704
- URL: https://www.wjgnet.com/1948-5204/full/v16/i8/3687.htm
- DOI: https://dx.doi.org/10.4251/wjgo.v16.i8.3687


