Copyright
©The Author(s) 2024.
World J Gastrointest Oncol. Aug 15, 2024; 16(8): 3687-3704
Published online Aug 15, 2024. doi: 10.4251/wjgo.v16.i8.3687
Published online Aug 15, 2024. doi: 10.4251/wjgo.v16.i8.3687
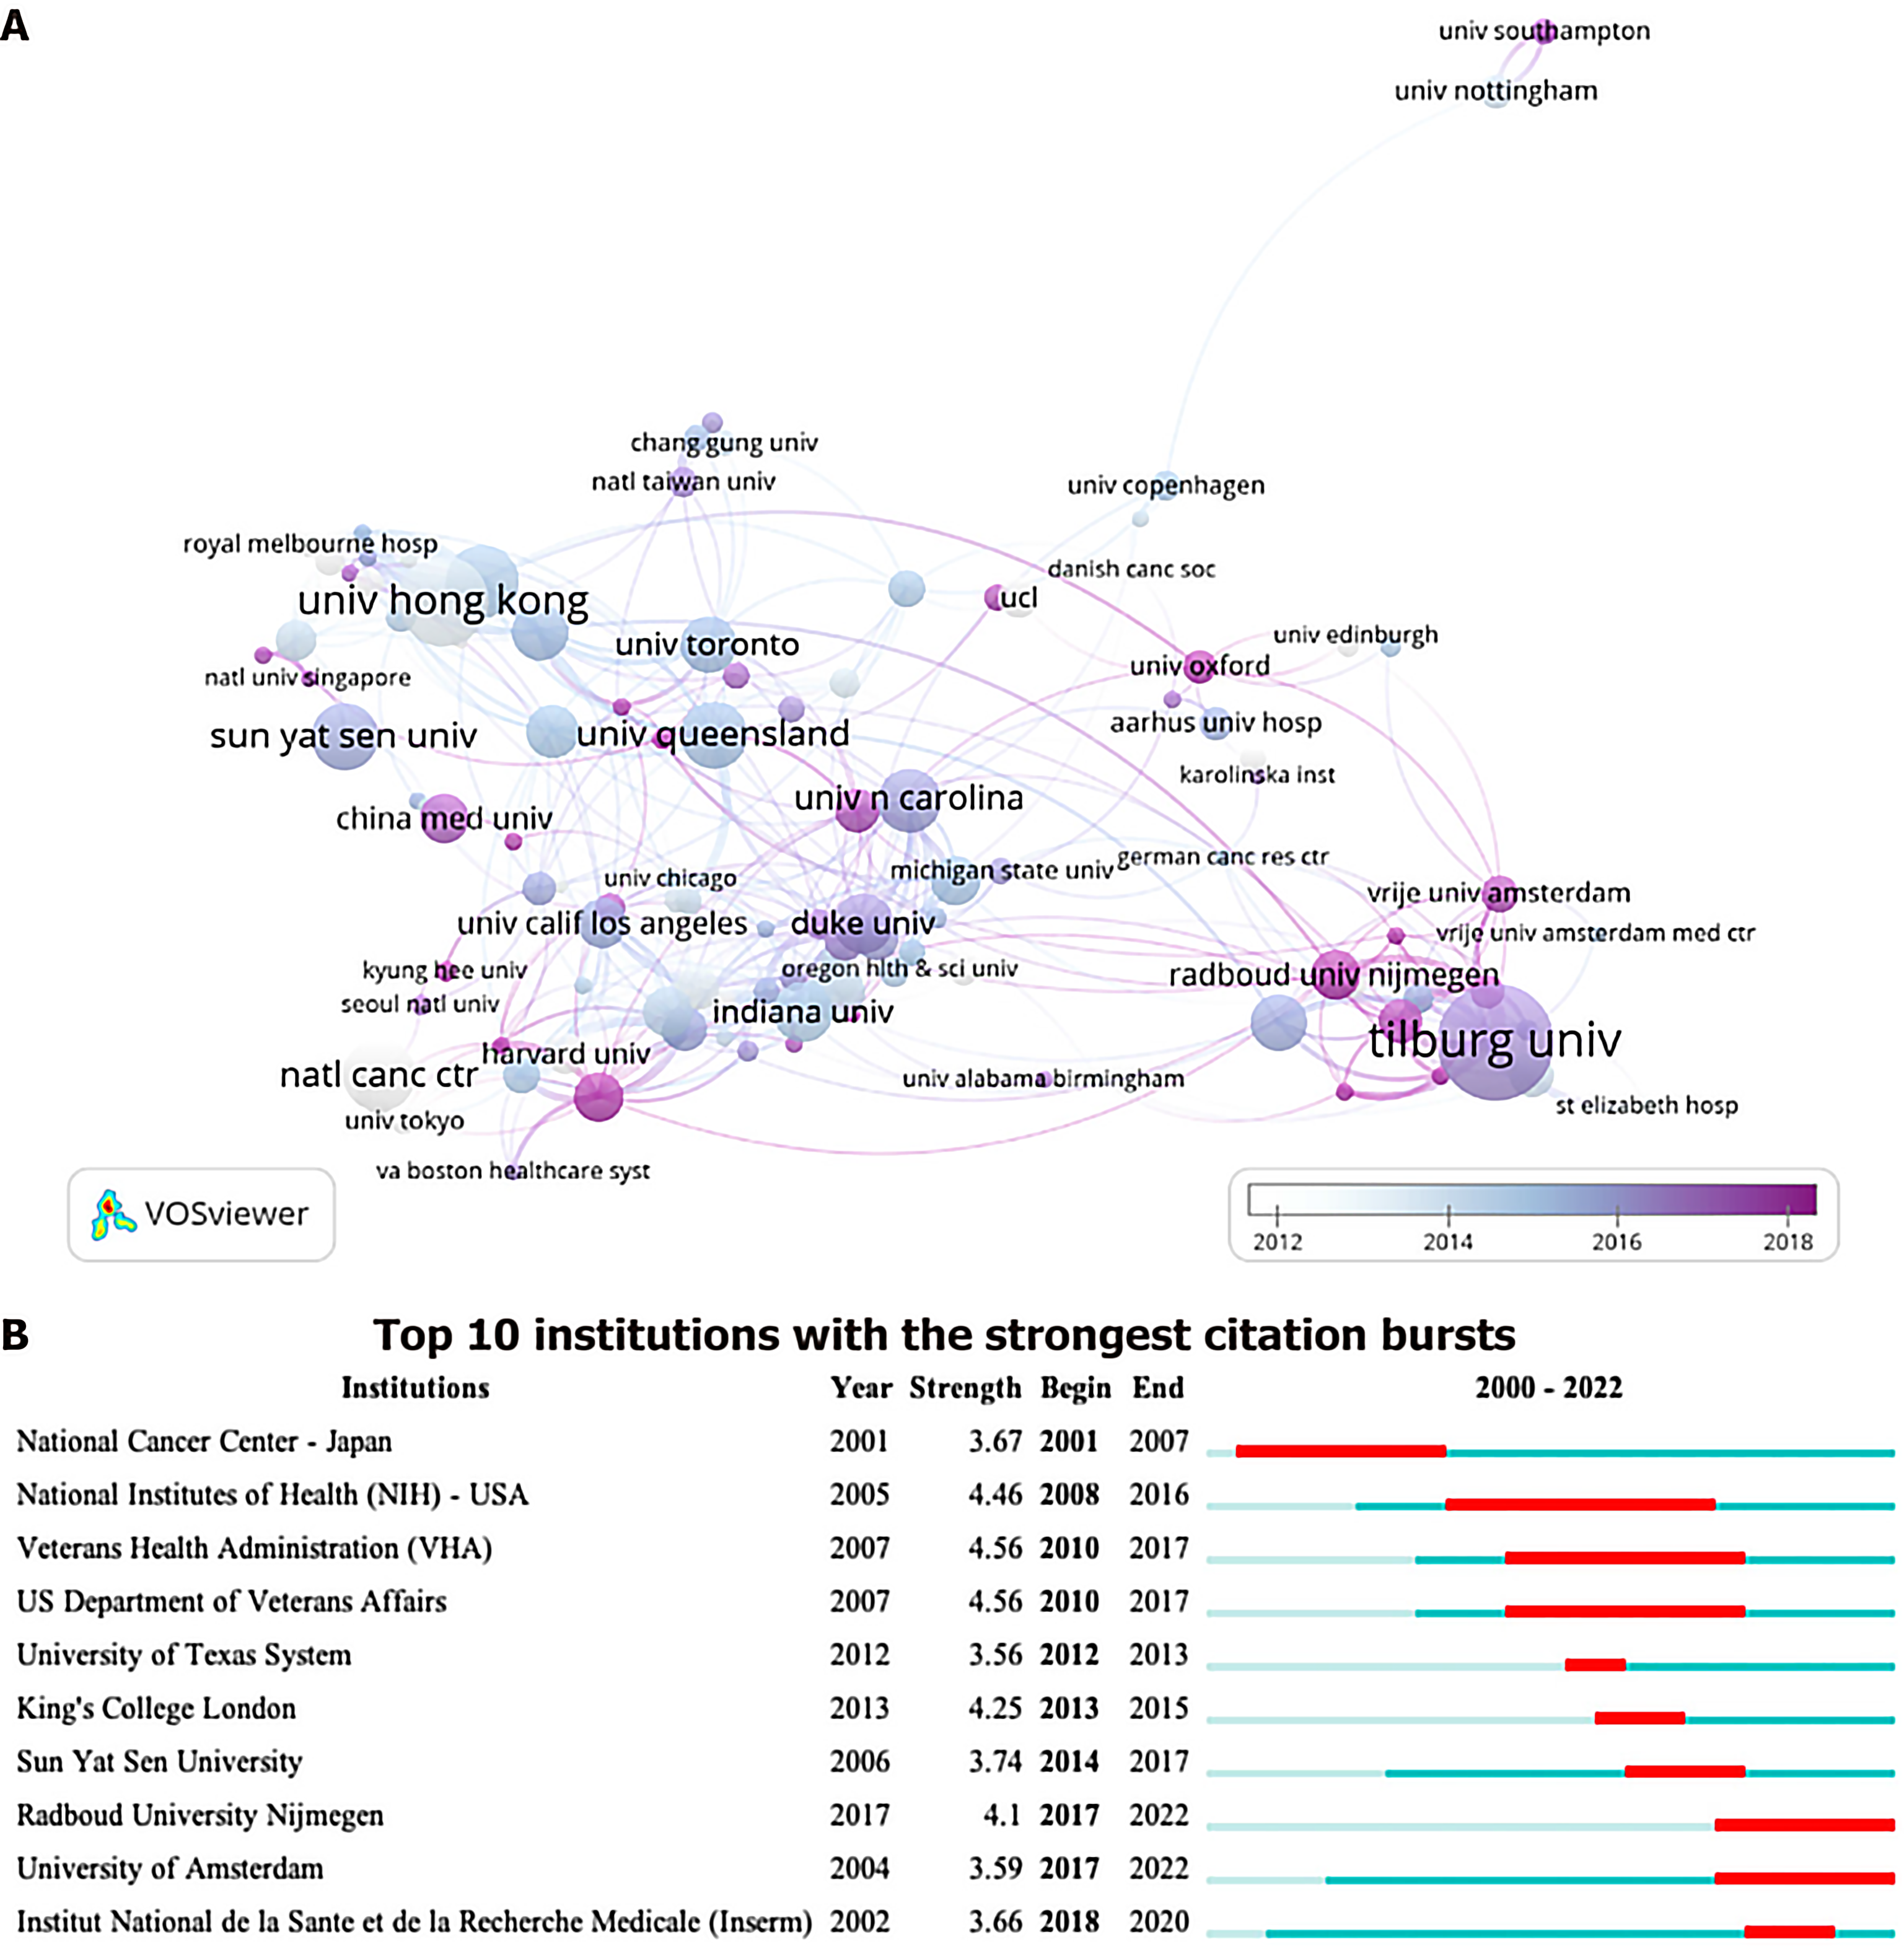
Figure 3 Cooperation map of institutes.
A: VOSviewer visualization map of the co-authorship network of institutions. The visualization map of publications for 121 institutions; a node represents one institution, the node size represents the number of publications, a link shows collaboration, and the distance and the thickness of the link between nodes show the relative strength of the relation. The color of each circle is determined by the year of publication, the darker the color, the more recent the publication; B: CiteSpace visualization map of top 10 institutions with strongest citation bursts. Red bars mean that some institutions are cited frequently in a certain period.
- Citation: Yan ZW, Liu YN, Xu Q, Yuan Y. Current trends and hotspots of depressive disorders with colorectal cancer: A bibliometric and visual study. World J Gastrointest Oncol 2024; 16(8): 3687-3704
- URL: https://www.wjgnet.com/1948-5204/full/v16/i8/3687.htm
- DOI: https://dx.doi.org/10.4251/wjgo.v16.i8.3687


