Copyright
©The Author(s) 2024.
World J Gastrointest Oncol. Aug 15, 2024; 16(8): 3651-3671
Published online Aug 15, 2024. doi: 10.4251/wjgo.v16.i8.3651
Published online Aug 15, 2024. doi: 10.4251/wjgo.v16.i8.3651
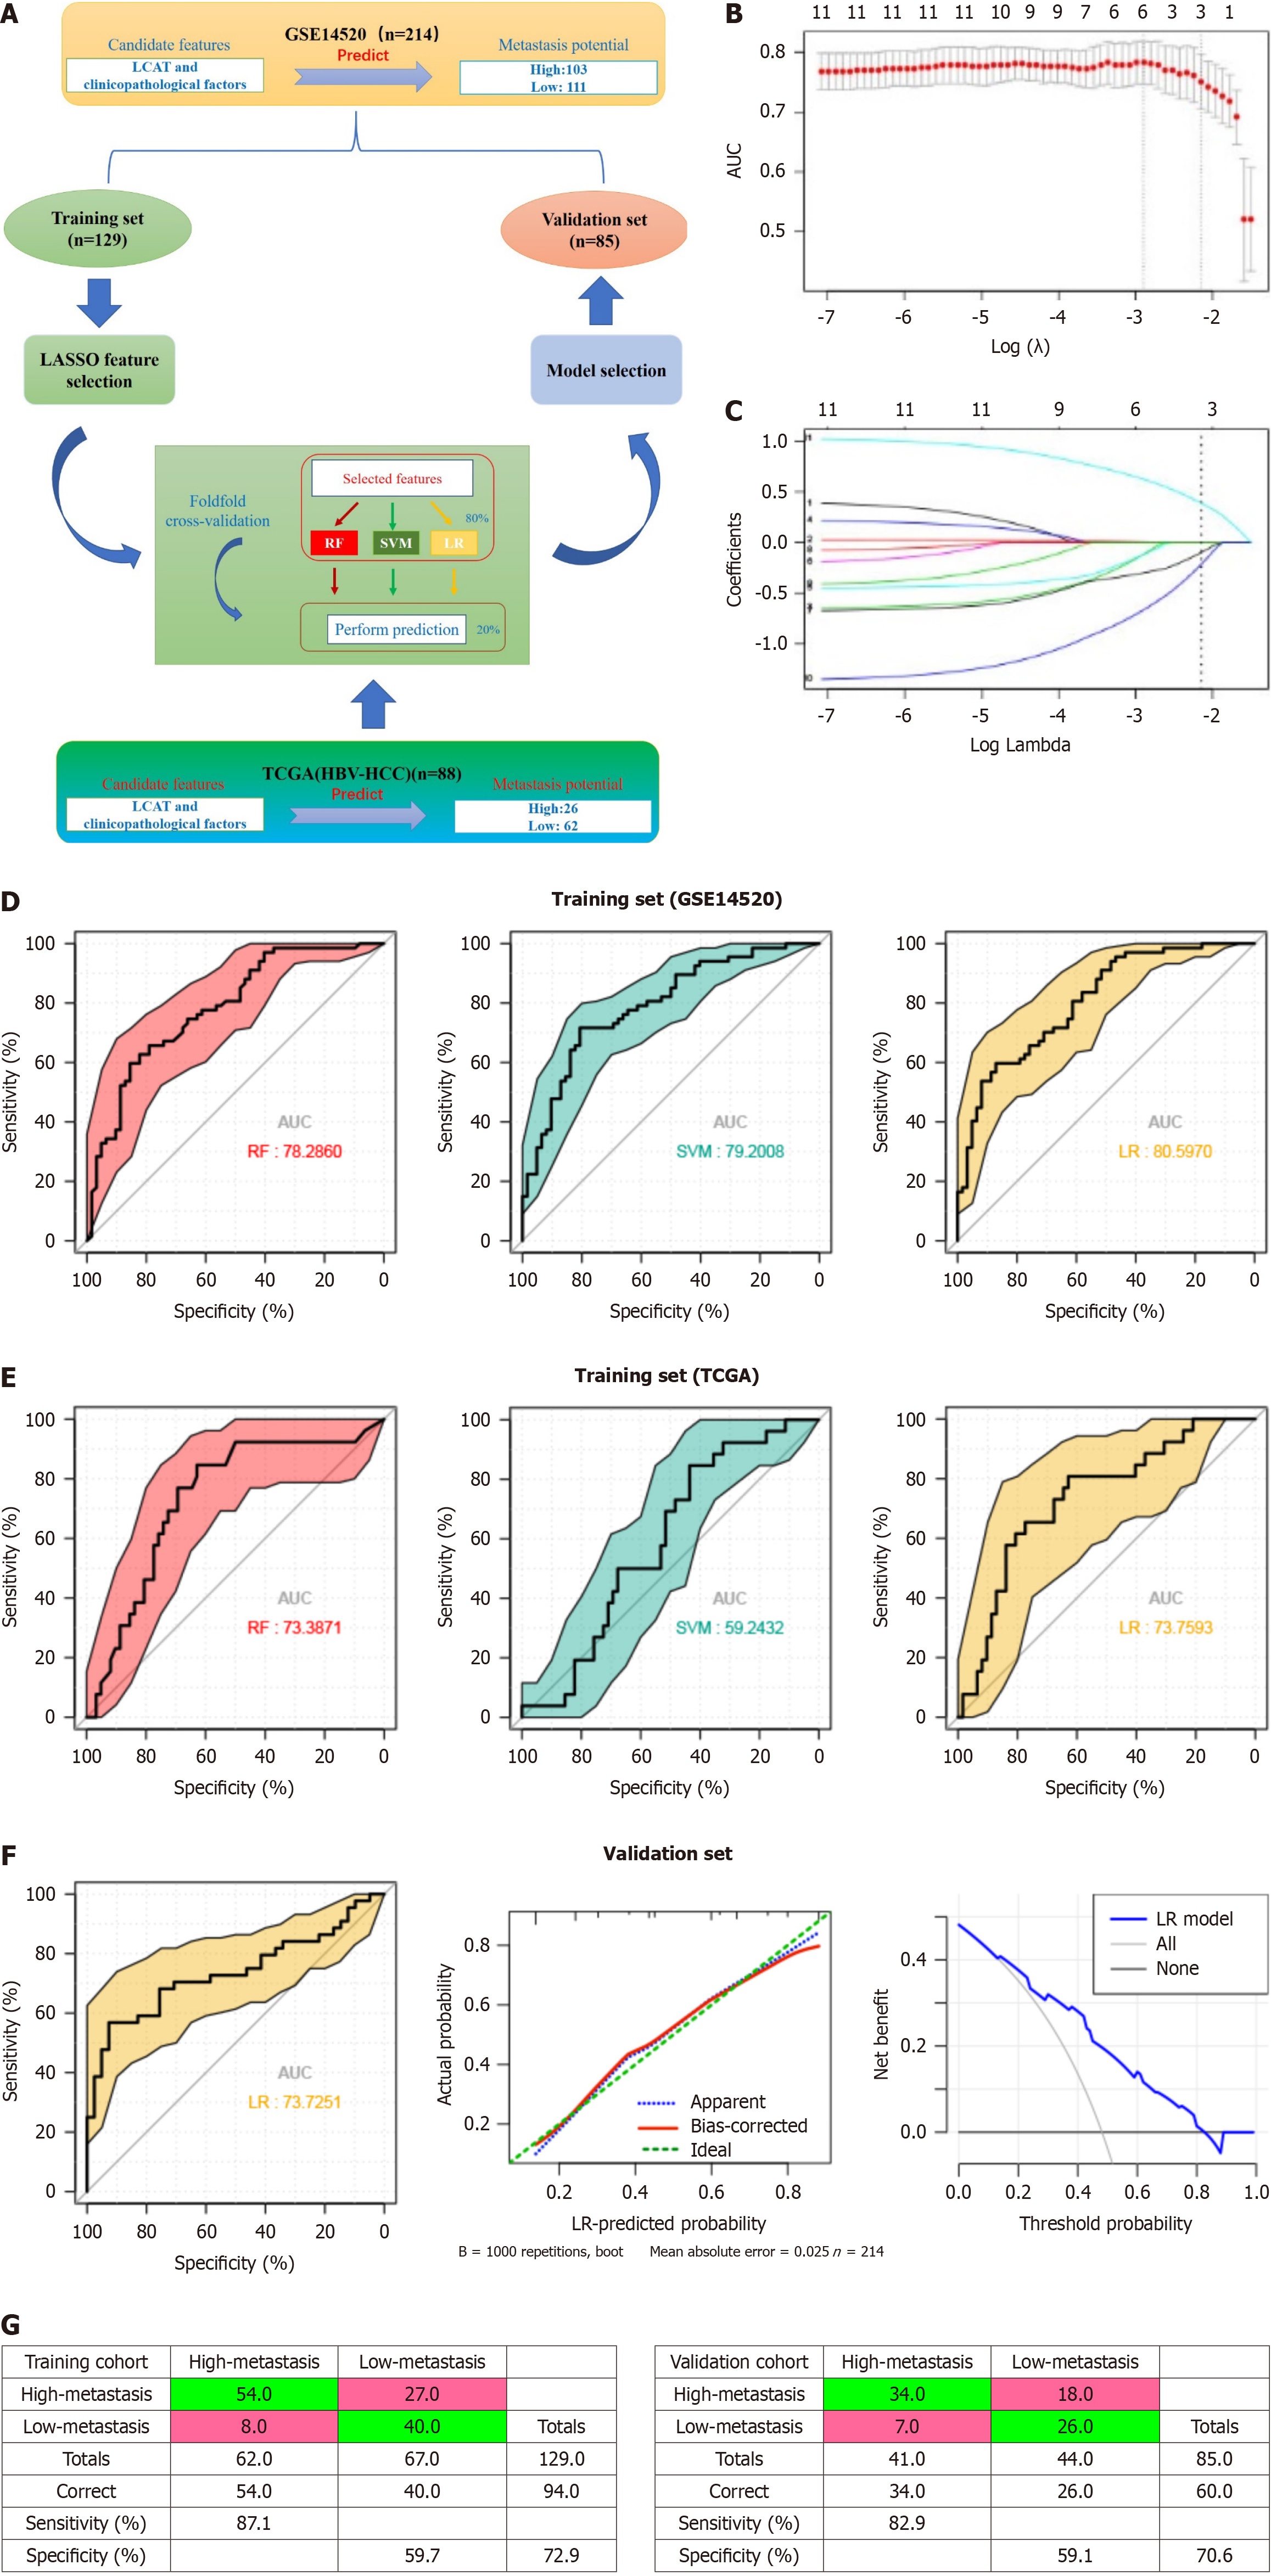
Figure 6 Predictive power of the models based on lecithin-cholesterol acyltransferase and clinicopathological characteristics in classification of metastasis subtypes.
A: Schematic representation of feature selection and classifiers building. The hepatocellular carcinoma (HCC) dataset (n = 214) was split into training (n = 129) and validation (n = 85) sets and feature selection was performed and classifiers were built through fivefold cross-validation within the training set and a dataset (n = 85) from The Cancer Genome Atlas (TCGA) database to select an optimal model. The best-performing model built from the whole training set was applied to the validation set; B and C: least absolute shrinkage and selection operator was performed to select the optimal features; D: Receiver operating characteristic (ROC) curves of the three classifiers based on the cross-validation within the training set (from GSE14520); E: ROC curves of the three classifiers based on the cross-validation within the training set from TCGA; F: ROC curve from applying the best-performing classifier (logistic regression, LR) built from the whole training set (from GSE14520) to the validation set, the calibration curve and decision curve for LR model in the validation set; G: Confusion tables of binary results of the HCC metastasis prediction model in the training and validation data sets. HCC: Hepatocellular carcinoma; HBV: Hepatitis B virus; TCGA: The Cancer Genome Atlas; LASSO: Least Absolute Shrinkage and Selection Operator; LR: Logistic regression.
- Citation: Li Y, Jiang LN, Zhao BK, Li ML, Jiang YY, Liu YS, Liu SH, Zhu L, Ye X, Zhao JM. Lecithin-cholesterol acyltransferase is a potential tumor suppressor and predictive marker for hepatocellular carcinoma metastasis. World J Gastrointest Oncol 2024; 16(8): 3651-3671
- URL: https://www.wjgnet.com/1948-5204/full/v16/i8/3651.htm
- DOI: https://dx.doi.org/10.4251/wjgo.v16.i8.3651


