Copyright
©The Author(s) 2024.
World J Gastrointest Oncol. Aug 15, 2024; 16(8): 3635-3650
Published online Aug 15, 2024. doi: 10.4251/wjgo.v16.i8.3635
Published online Aug 15, 2024. doi: 10.4251/wjgo.v16.i8.3635
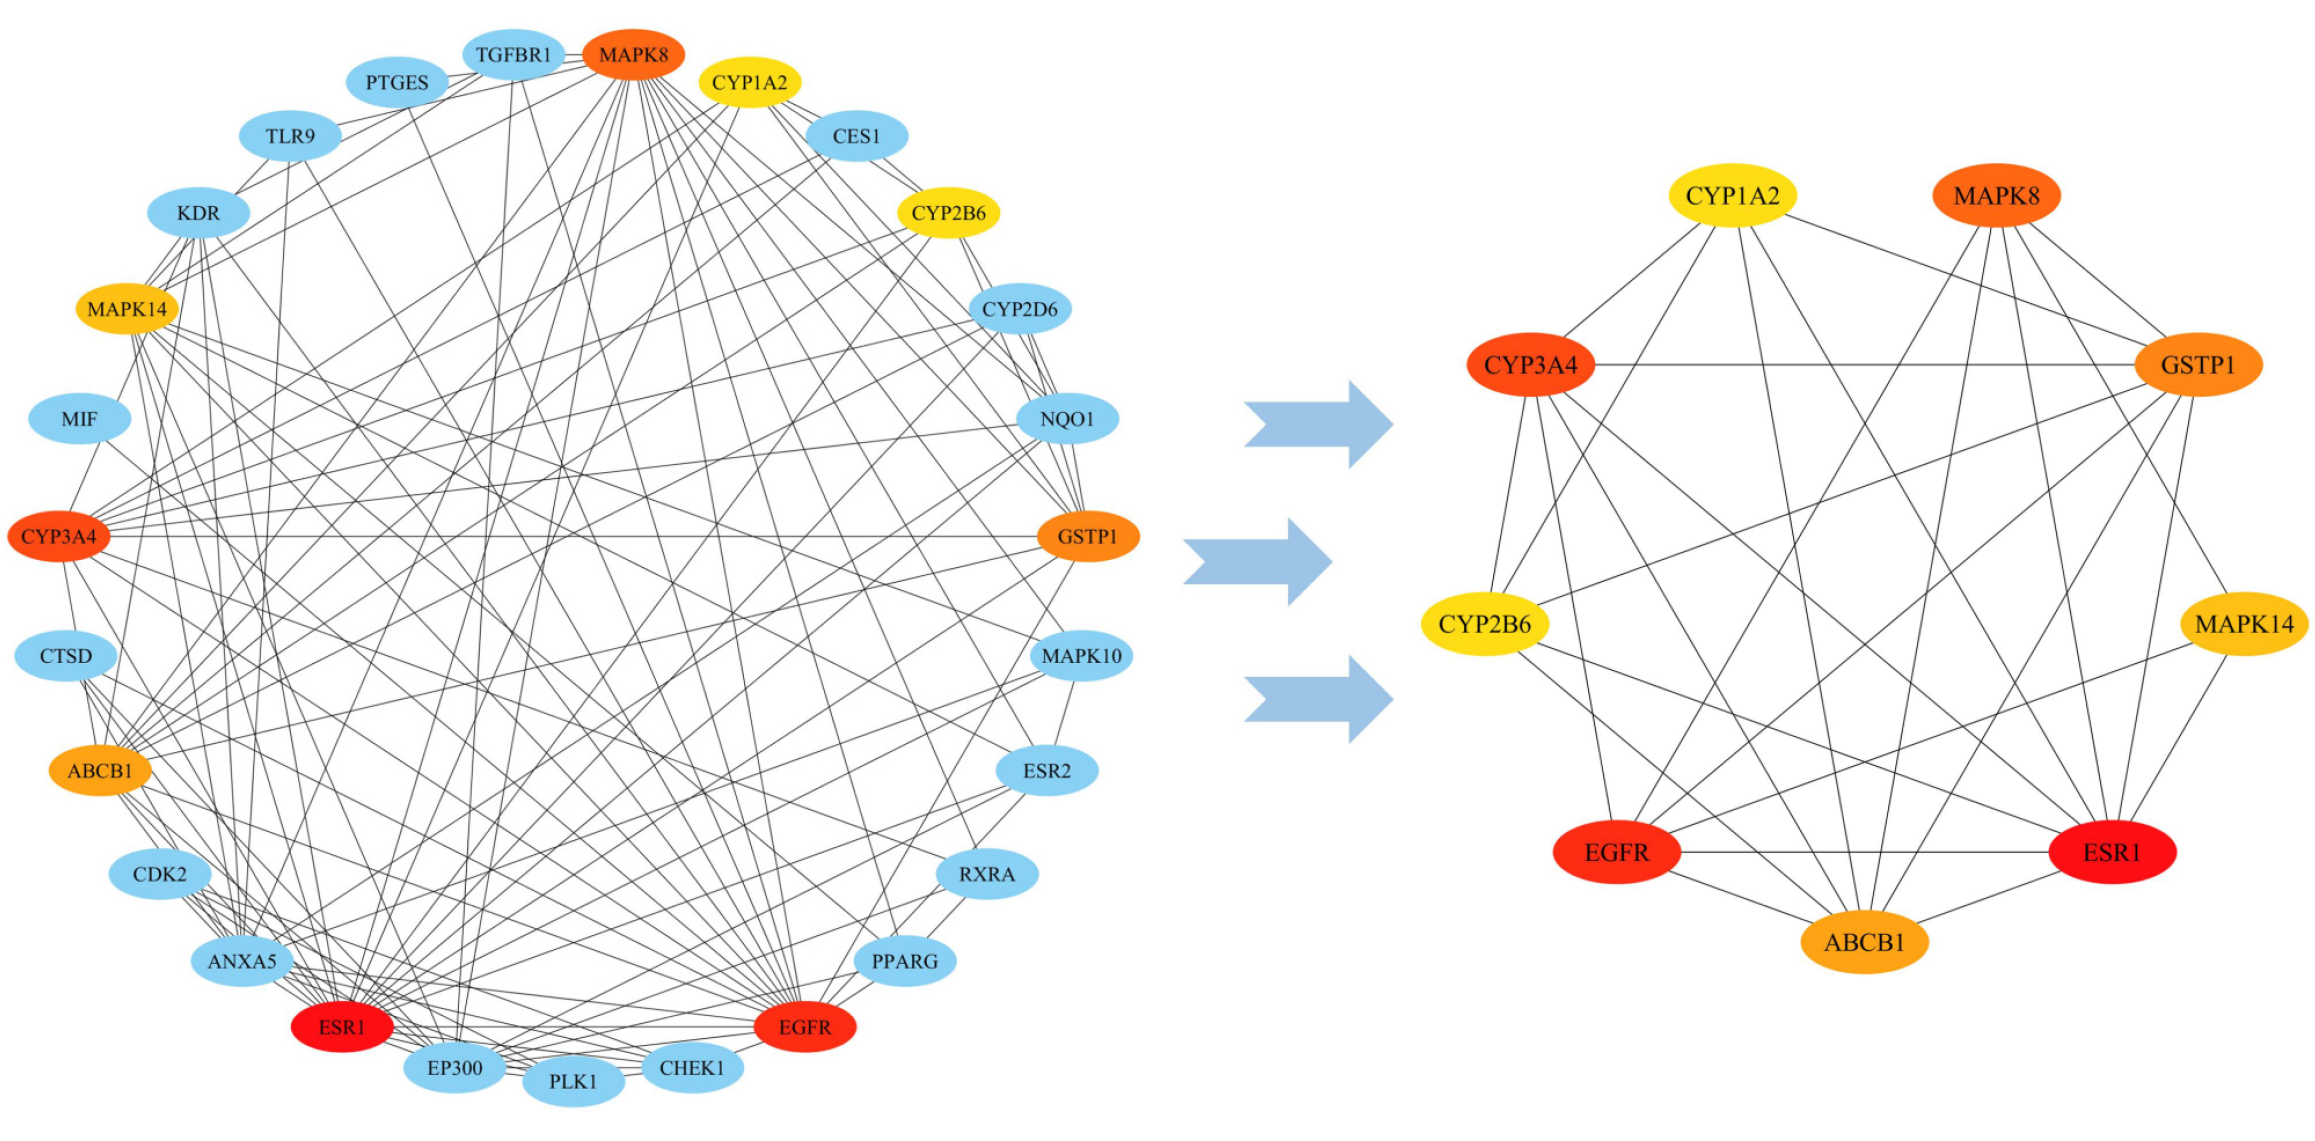
Figure 3 Protein-protein interaction network.
The network on the left represents the topological analysis of the network for curcumin–gastric cancer intersection targets, with the color becoming increasingly red as the degree value increases. The network on the right represents the topological graph of the target gene network with the top 8 degree values. ESR1: Estrogen receptor 1; EGFR: Epidermal growth factor receptor; CYP3A4: Cytochrome P450 family 3 subfamily A member 4; MAPK14: Mitogen-activated protein kinase 14; CYP1A2: Cytochrome P450 family 1 subfamily A member 2; CYP2B6: Cytochrome P450 family 2 subfamily B member 6.
- Citation: Yang PH, Wei YN, Xiao BJ, Li SY, Li XL, Yang LJ, Pan HF, Chen GX. Curcumin for gastric cancer: Mechanism prediction via network pharmacology, docking, and in vitro experiments. World J Gastrointest Oncol 2024; 16(8): 3635-3650
- URL: https://www.wjgnet.com/1948-5204/full/v16/i8/3635.htm
- DOI: https://dx.doi.org/10.4251/wjgo.v16.i8.3635


