Copyright
©The Author(s) 2024.
World J Gastrointest Oncol. Aug 15, 2024; 16(8): 3600-3623
Published online Aug 15, 2024. doi: 10.4251/wjgo.v16.i8.3600
Published online Aug 15, 2024. doi: 10.4251/wjgo.v16.i8.3600
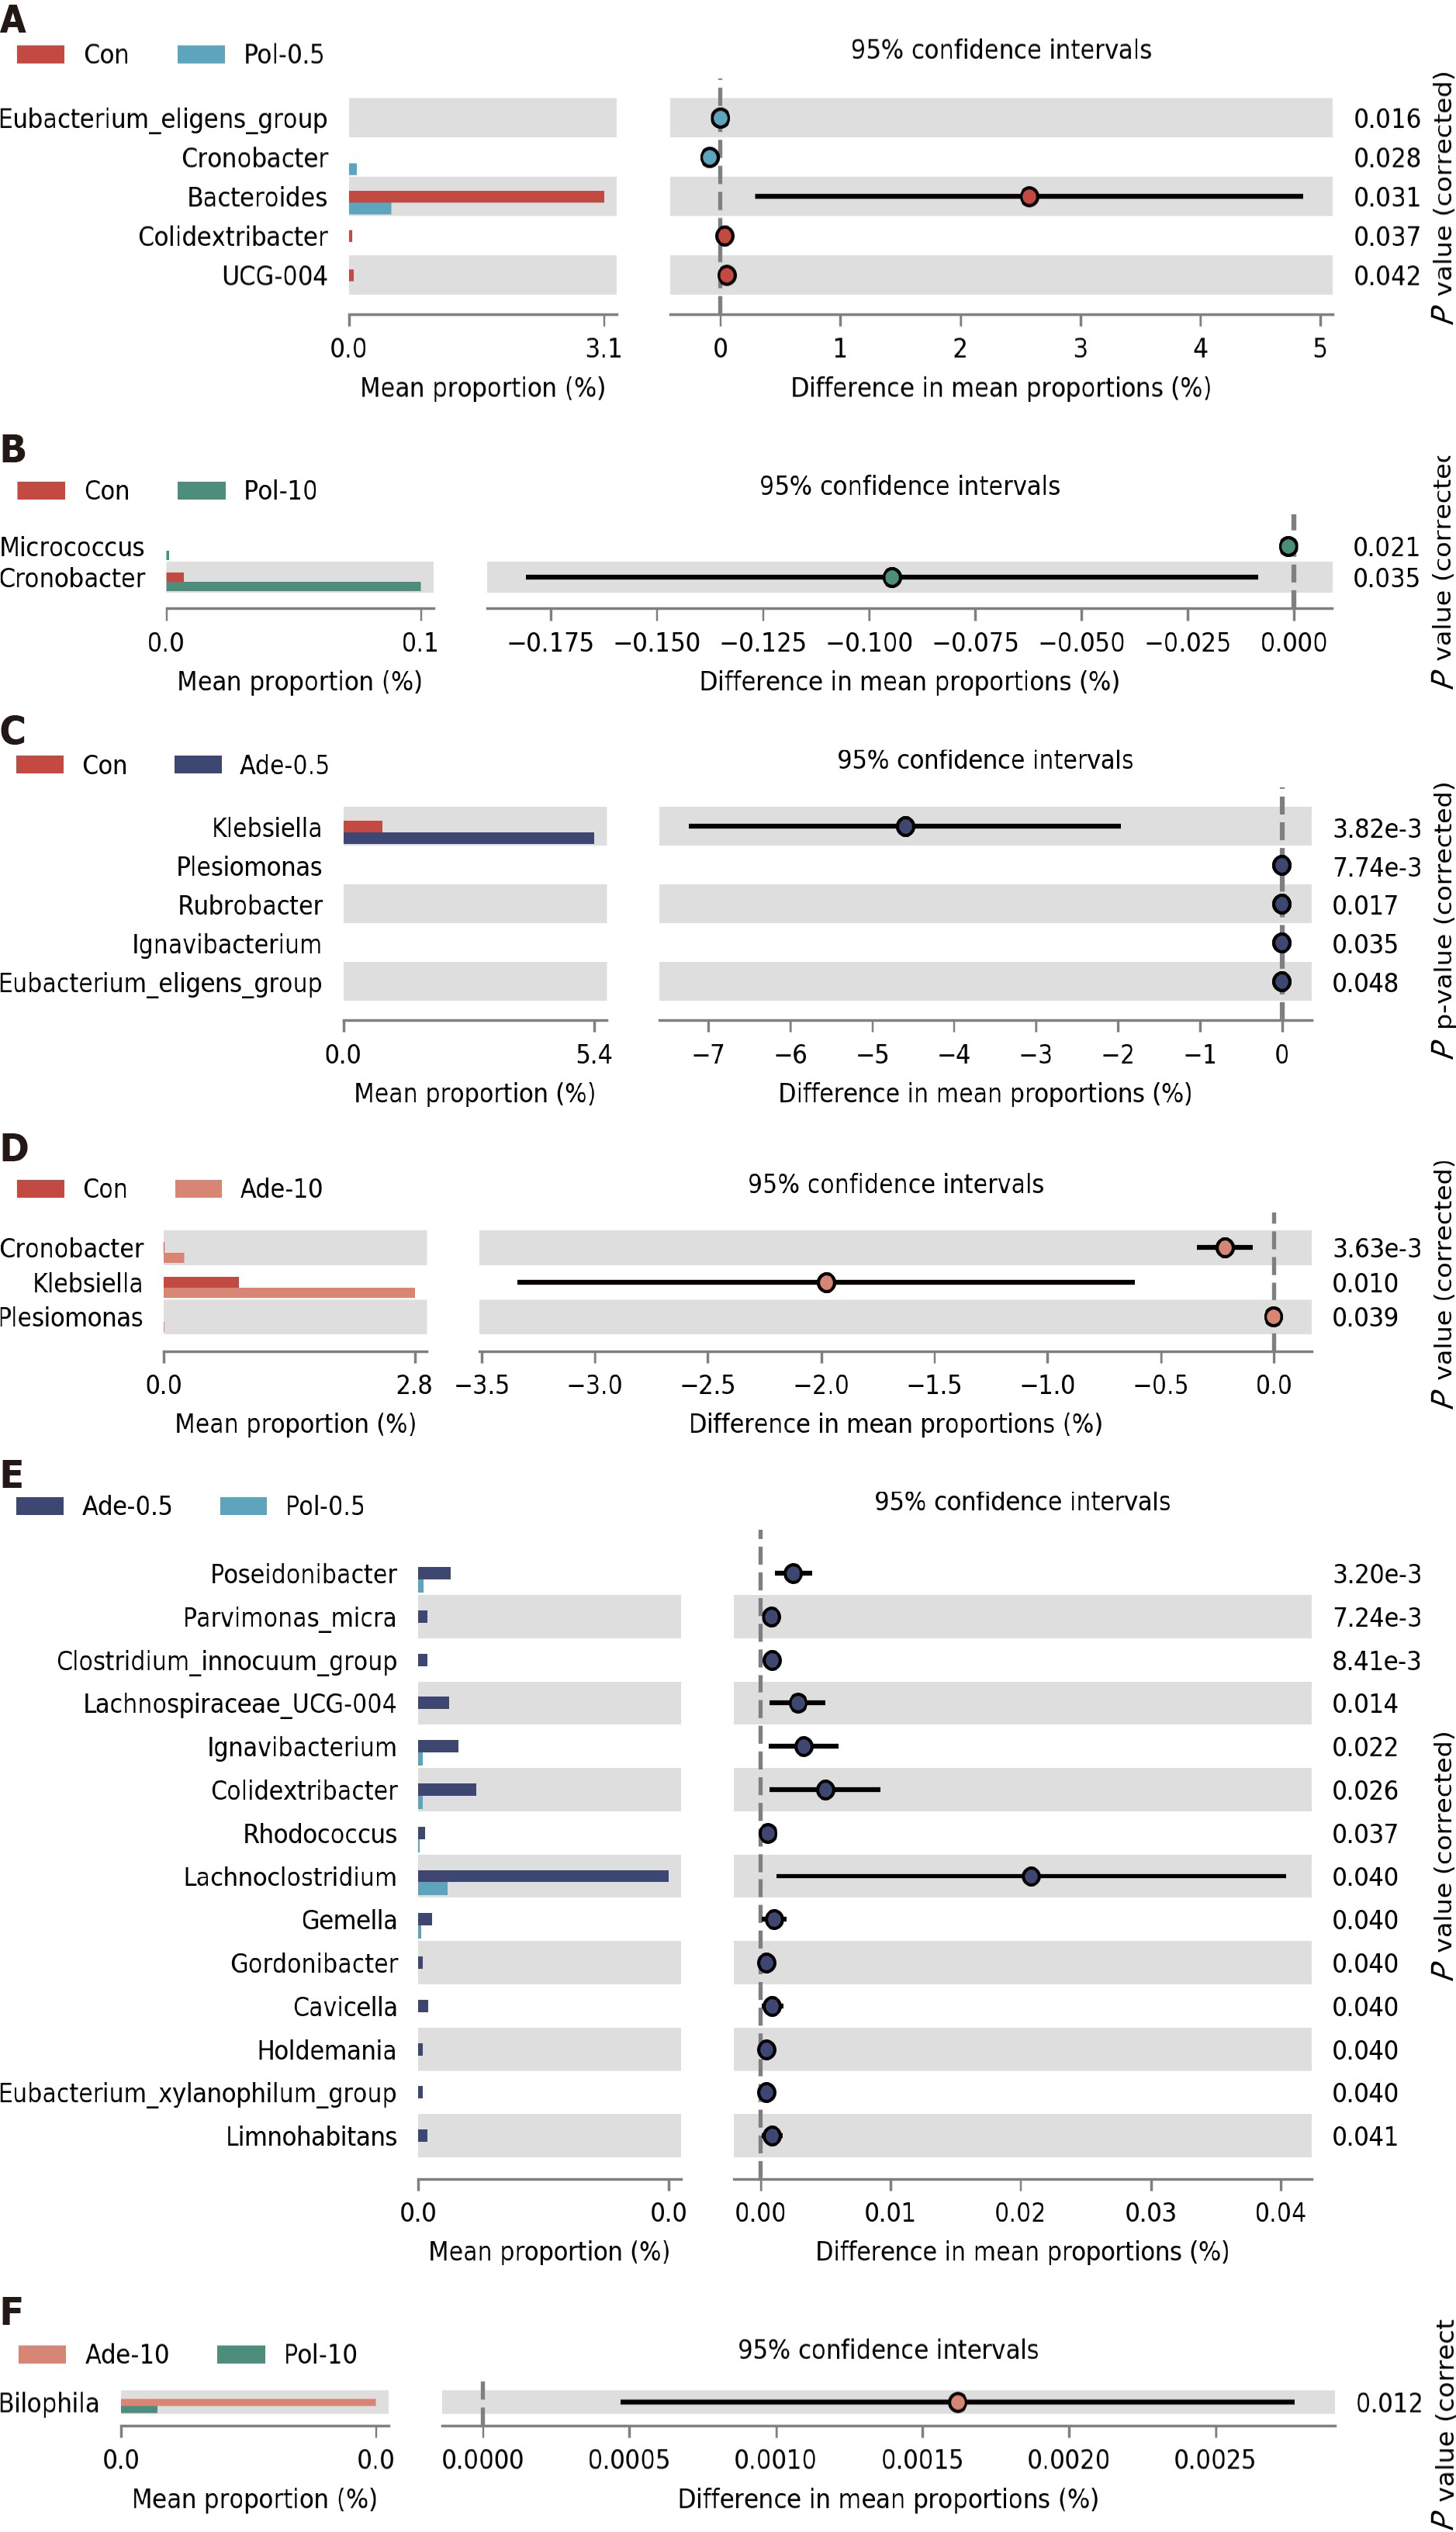
Figure 6 Bar chart of test for multi-species differences between different groups.
Student’s t-test was used to evaluate the level of significance of multi-species differences at the genus level. The closer the line is to the middle, the smaller the standard deviation and the better the central tendency. A-D: Results of non-adenomatous polyps (Pol)-0.5, Pol-10, adenomatous polyps (Ade)-0.5, and Ade-10 compared with the control group, respectively; E and F: Results of Pol-0.5 compared with Ade-0.5 and Pol-10 compared with Ade-10, respectively. Ade: Adenomatous polyps; Pol: Non-adenomatous polyps; Con: Control.
- Citation: Yin LL, Qi PQ, Hu YF, Fu XJ, He RS, Wang MM, Deng YJ, Xiong SY, Yu QW, Hu JP, Zhou L, Zhou ZB, Xiong Y, Deng H. Dysbiosis promotes recurrence of adenomatous polyps in the distal colorectum. World J Gastrointest Oncol 2024; 16(8): 3600-3623
- URL: https://www.wjgnet.com/1948-5204/full/v16/i8/3600.htm
- DOI: https://dx.doi.org/10.4251/wjgo.v16.i8.3600


