Copyright
©The Author(s) 2024.
World J Gastrointest Oncol. Aug 15, 2024; 16(8): 3600-3623
Published online Aug 15, 2024. doi: 10.4251/wjgo.v16.i8.3600
Published online Aug 15, 2024. doi: 10.4251/wjgo.v16.i8.3600
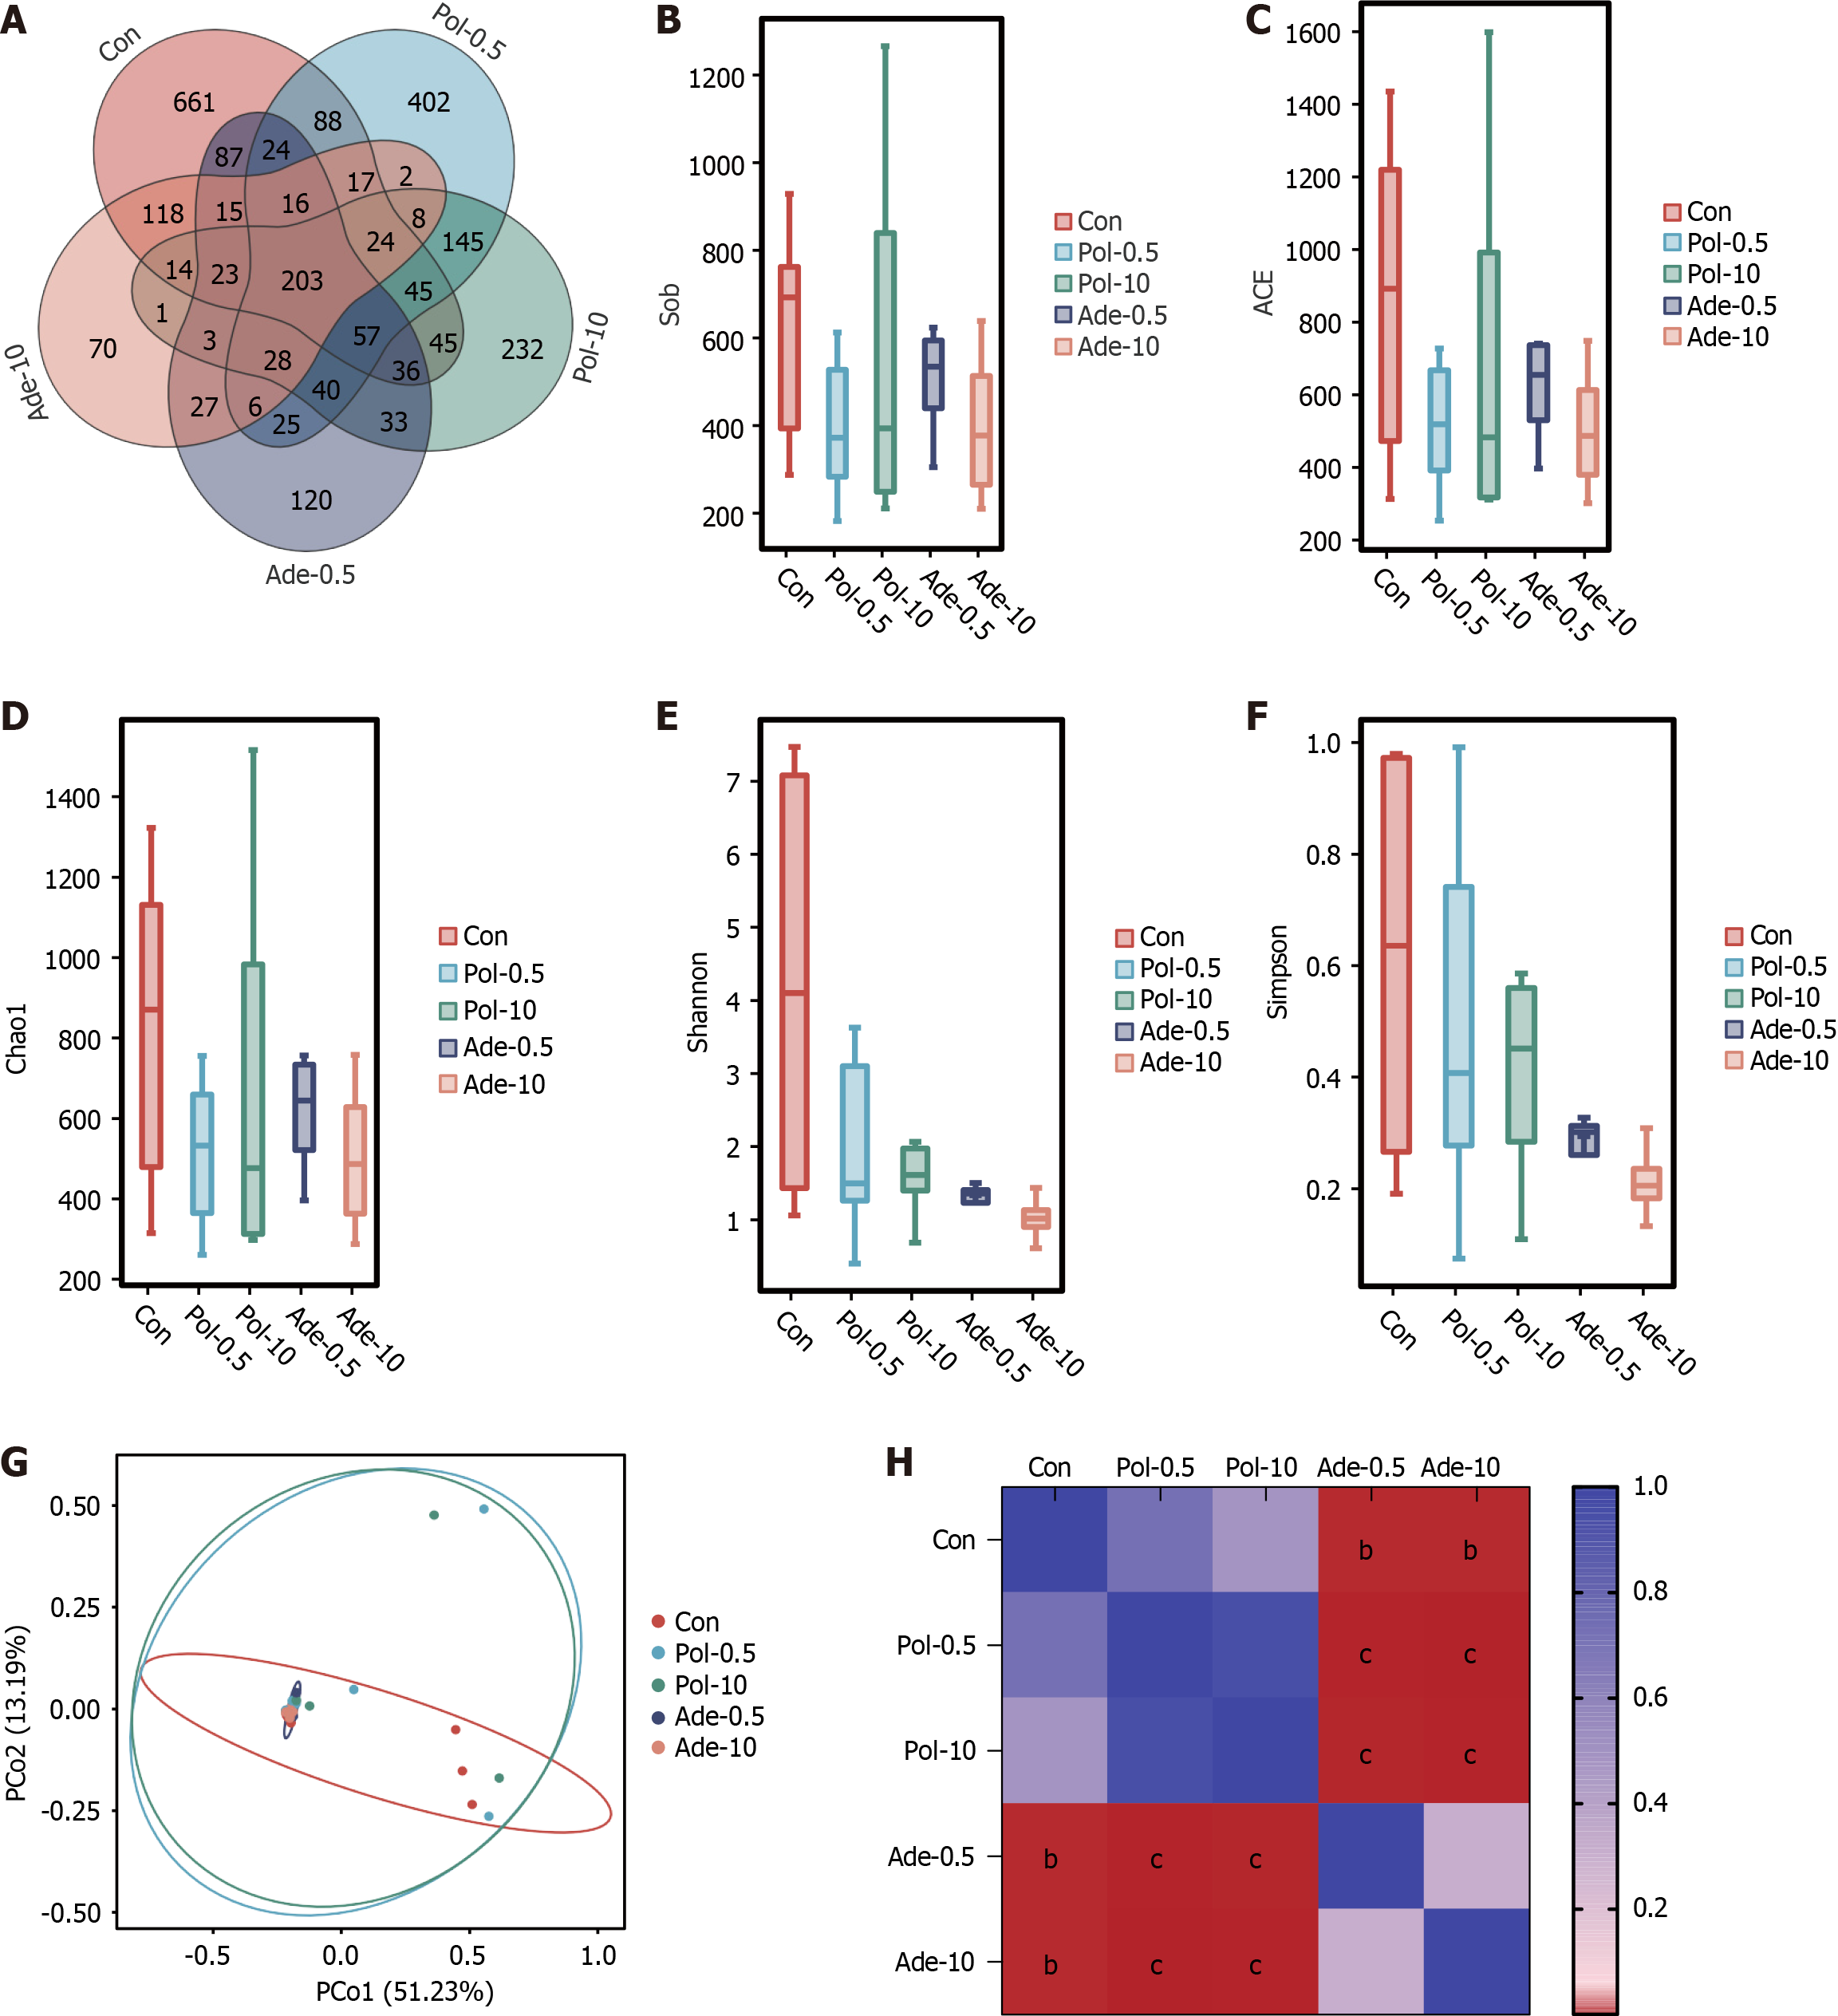
Figure 5 Comparison of mucosal diversity between normal human distal colorectum and patients with recurrent colorectal polyps of different pathologic types.
A: Venn diagram of the total number of species in the five groups at the operational taxonomic unit level; B-F: Comparison of α diversity analysis, richness, evenness, and diversity between five groups. Sob (B), Chao1 (C), ACE (D), Shannon index (E), and Simpson index (F) are compared; G: Plot of principal component analysis of gut microbiome groups based on Wilcoxon test metrics of operational taxonomic unit level bray distance; H: Heatmap of β diversity values based on rank-sum test between two groups. bP < 0.01, cP < 0.001. Ade: Adenomatous polyps; Pol: Non-adenomatous polyps; Con: Control.
- Citation: Yin LL, Qi PQ, Hu YF, Fu XJ, He RS, Wang MM, Deng YJ, Xiong SY, Yu QW, Hu JP, Zhou L, Zhou ZB, Xiong Y, Deng H. Dysbiosis promotes recurrence of adenomatous polyps in the distal colorectum. World J Gastrointest Oncol 2024; 16(8): 3600-3623
- URL: https://www.wjgnet.com/1948-5204/full/v16/i8/3600.htm
- DOI: https://dx.doi.org/10.4251/wjgo.v16.i8.3600


