Copyright
©The Author(s) 2024.
World J Gastrointest Oncol. Aug 15, 2024; 16(8): 3600-3623
Published online Aug 15, 2024. doi: 10.4251/wjgo.v16.i8.3600
Published online Aug 15, 2024. doi: 10.4251/wjgo.v16.i8.3600
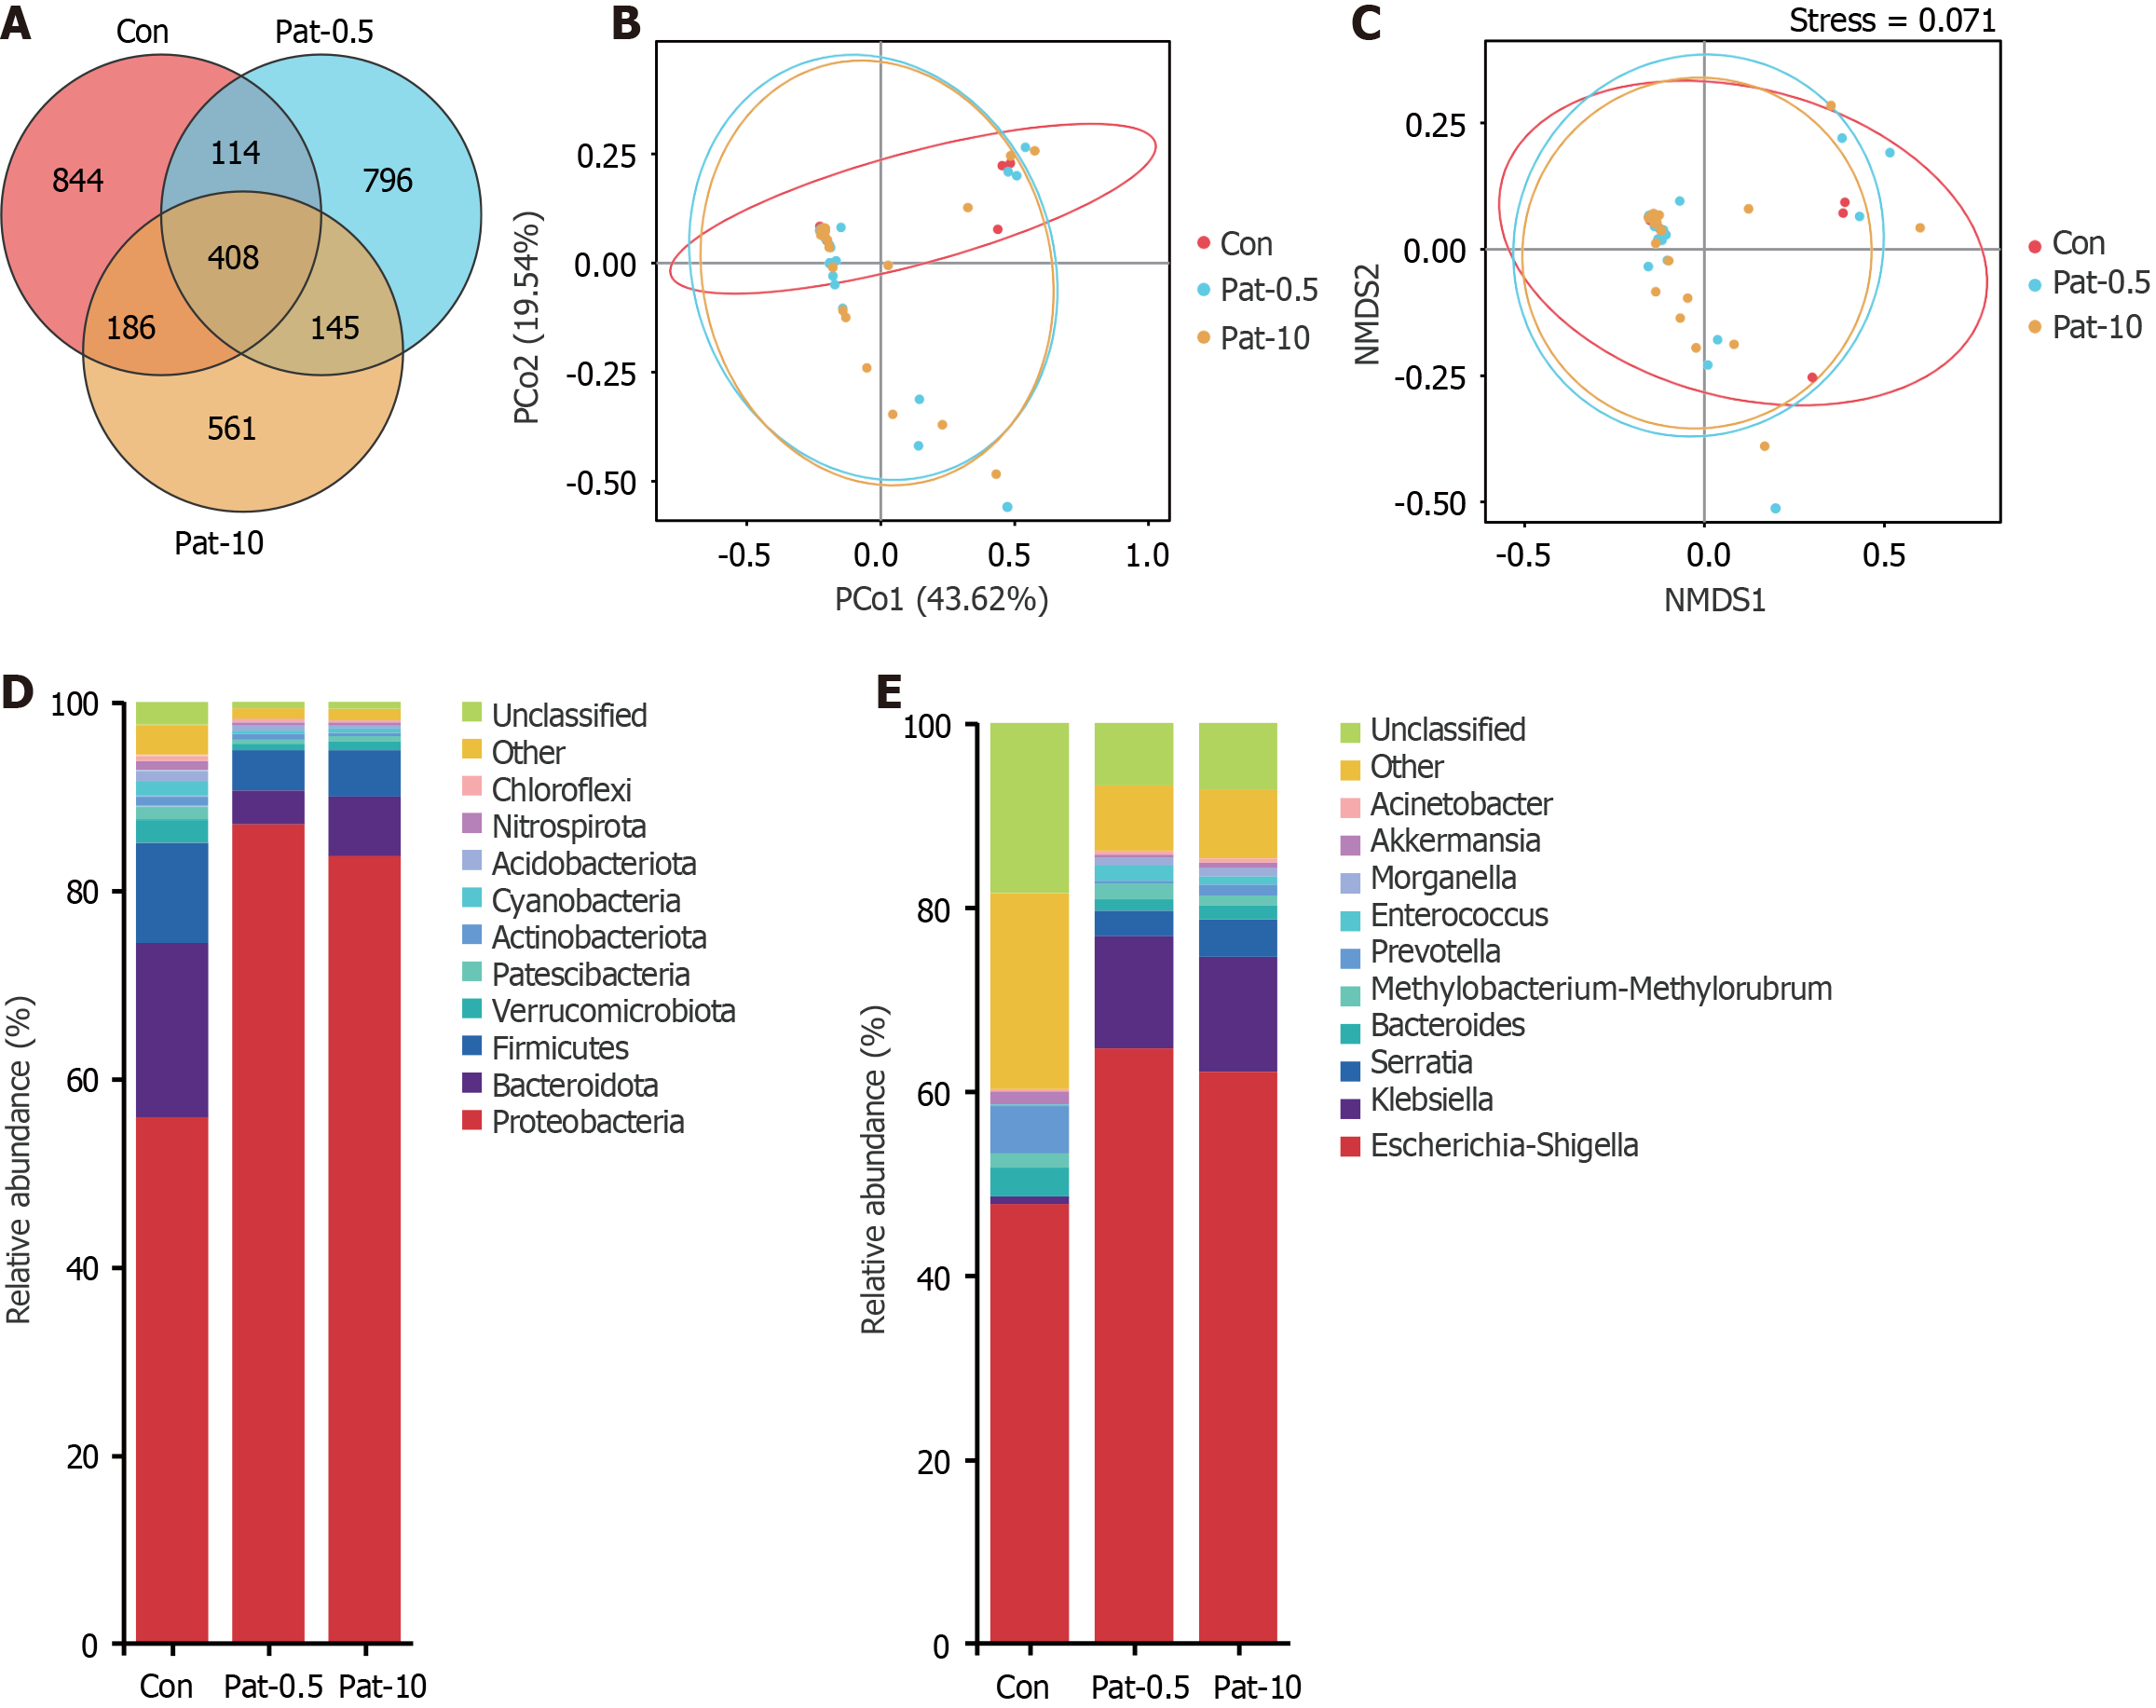
Figure 2 Mucosal microbiome composition and differences between control, patient-0.
5, and patient-10 groups. A: Wayne plots of the total number of species in the three groups at the operational taxonomic unit level showing the composition of the mucosal microbiome in each group. Red represents control mucosa, light blue represents the patient (Pat)-0.5 group, yellow represents the Pat-10 group, and the number of non-overlapping species represents the number of species specific to the corresponding group; B and C: Cumulative percentage histograms of the top 10 bacterial species with the highest abundance at the phylum and genus levels for the three groups; D and E: Differences in mucosal microbiome composition between the control group and the group of patients with recurrent colorectal polyps assessed using principal coordinate analysis and non-metric multidimensional scaling analysis. P values were calculated by the Wilcoxon’s test at the level of the bray distance operational taxonomic unit. Pat: Patient; Con: Control.
- Citation: Yin LL, Qi PQ, Hu YF, Fu XJ, He RS, Wang MM, Deng YJ, Xiong SY, Yu QW, Hu JP, Zhou L, Zhou ZB, Xiong Y, Deng H. Dysbiosis promotes recurrence of adenomatous polyps in the distal colorectum. World J Gastrointest Oncol 2024; 16(8): 3600-3623
- URL: https://www.wjgnet.com/1948-5204/full/v16/i8/3600.htm
- DOI: https://dx.doi.org/10.4251/wjgo.v16.i8.3600


