Copyright
©The Author(s) 2024.
World J Gastrointest Oncol. Aug 15, 2024; 16(8): 3539-3558
Published online Aug 15, 2024. doi: 10.4251/wjgo.v16.i8.3539
Published online Aug 15, 2024. doi: 10.4251/wjgo.v16.i8.3539
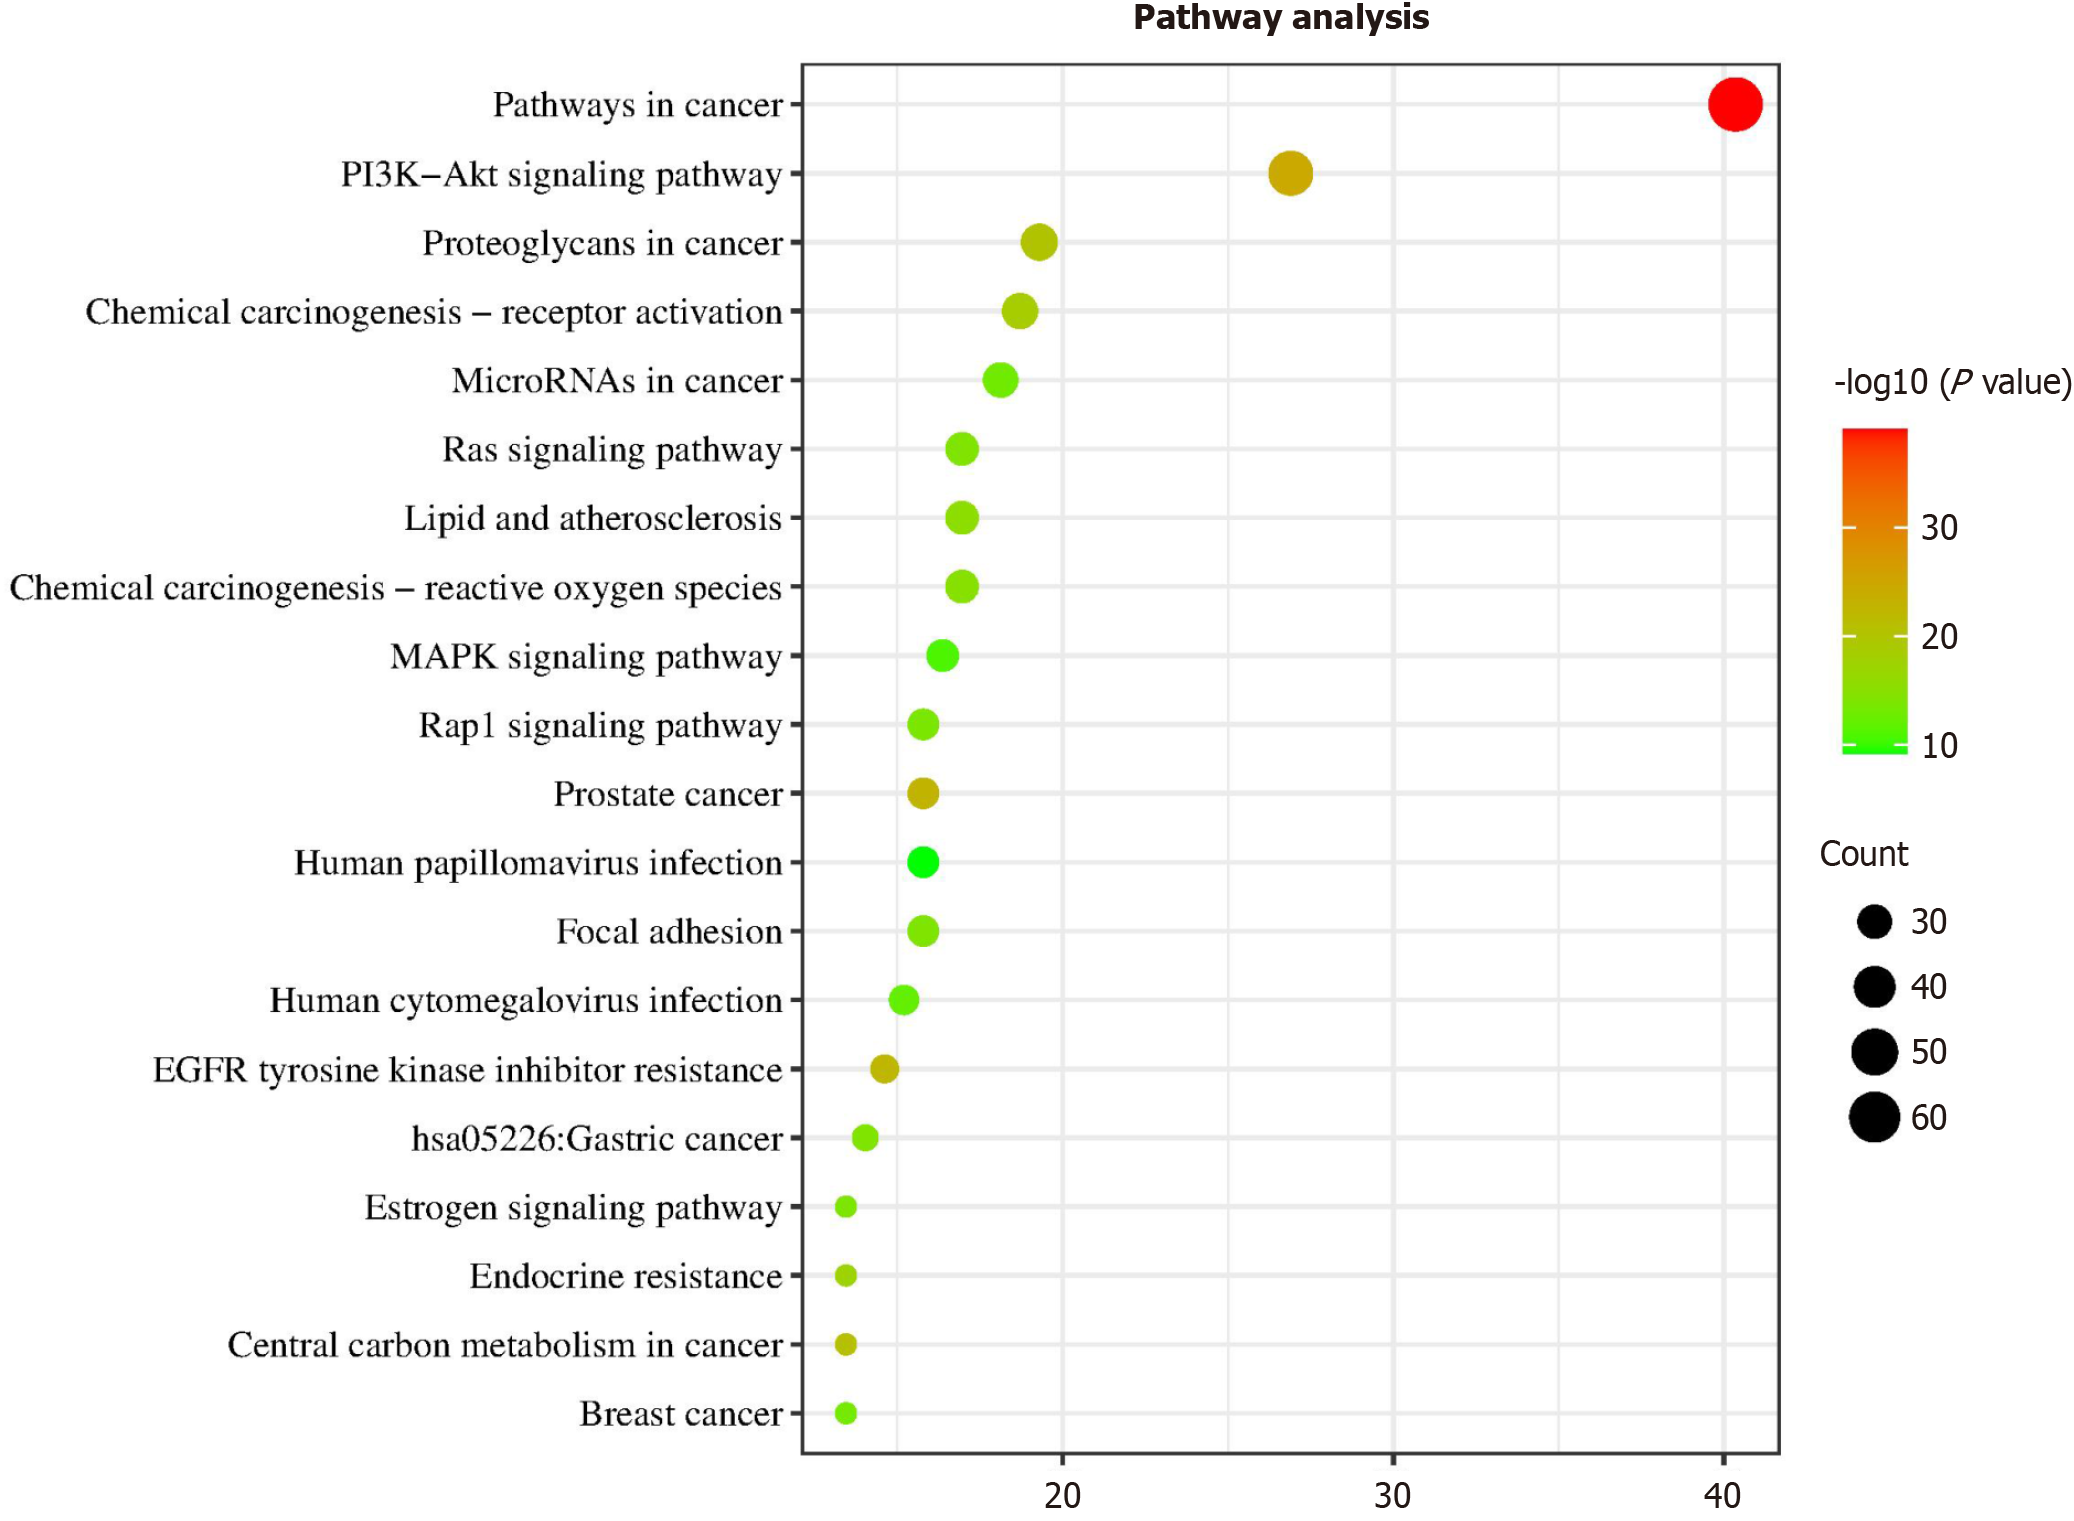
Figure 5 Kyoto Encyclopedia of Genes and Genomes pathway enrichment analysis.
The X-axis denotes the enrichment rate of these genes within the total gene pool, whereas the Y-axis indicates the enrichment pathway of the target gene (P ≤ 0.05). The depth of the color corresponds to the magnitude of the value, whereas the size of the circle reflects the enrichment count of these pathways. The top five signaling pathways are: Pathways in cancer, phosphoinositide 3-kinase-Akt signaling pathway, proteoglycans in cancer, chemical carcinogenesis, receptor activation, and microRNAs in cancer.
- Citation: Wang CL, Yang BW, Wang XY, Chen X, Li WD, Zhai HY, Wu Y, Cui MY, Wu JH, Meng QH, Zhang N. Targeting colorectal cancer with Herba Patriniae and Coix seed: Network pharmacology, molecular docking, and in vitro validation. World J Gastrointest Oncol 2024; 16(8): 3539-3558
- URL: https://www.wjgnet.com/1948-5204/full/v16/i8/3539.htm
- DOI: https://dx.doi.org/10.4251/wjgo.v16.i8.3539


