Copyright
©The Author(s) 2024.
World J Gastrointest Oncol. Aug 15, 2024; 16(8): 3507-3520
Published online Aug 15, 2024. doi: 10.4251/wjgo.v16.i8.3507
Published online Aug 15, 2024. doi: 10.4251/wjgo.v16.i8.3507
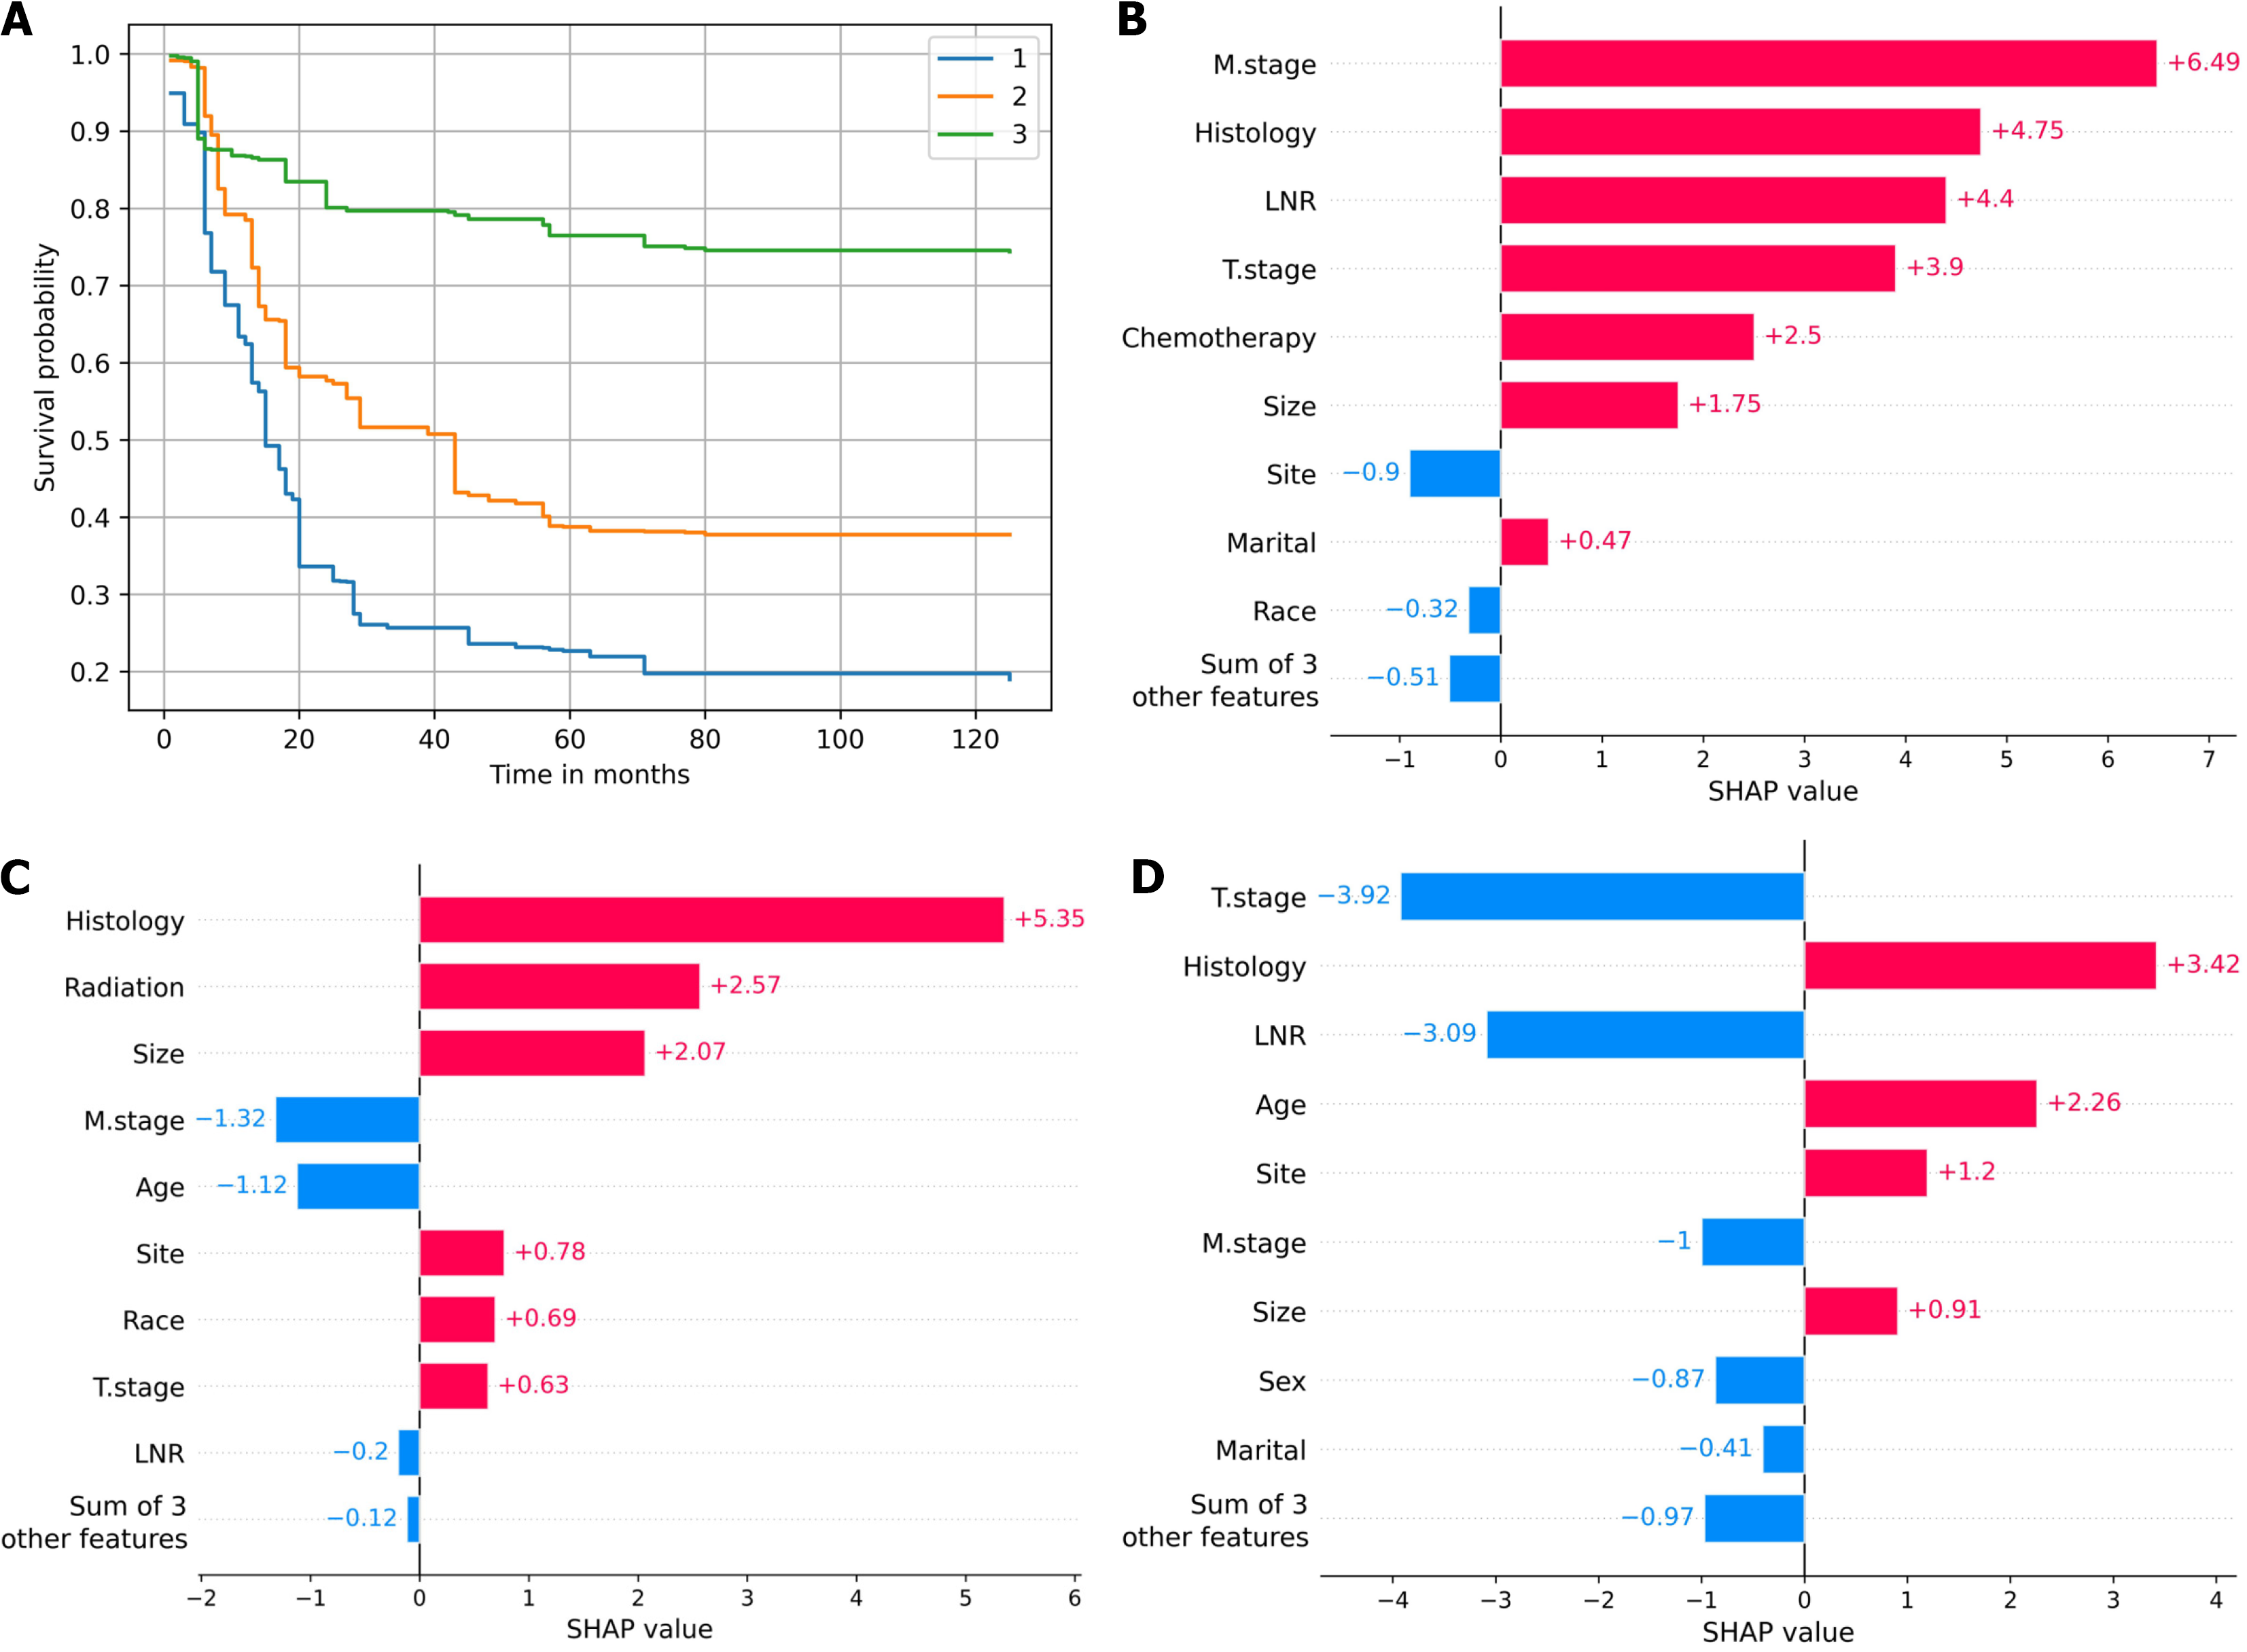
Figure 9 The individual prediction for postoperative gastric neuroendocrine neoplasm patients.
A: The survival probability at each time point of patient #1, patient #2, and patient #3; B: The local SHapley Additive exPlanations (SHAP) plot of the patient #1; C: The local SHAP plot of the patient #2; D: The local SHAP plot of the patient #3. The red color illustrated the variable was positively correlated with the outcome of the patient and the blue color illustrated the variable was negatively correlated with the outcome of the patient. LNR: Lymph node ratio; SHAP: SHapley Additive exPlanations.
- Citation: Liu W, Wu HY, Lin JX, Qu ST, Gu YJ, Zhu JZ, Xu CF. Combining lymph node ratio to develop prognostic models for postoperative gastric neuroendocrine neoplasm patients. World J Gastrointest Oncol 2024; 16(8): 3507-3520
- URL: https://www.wjgnet.com/1948-5204/full/v16/i8/3507.htm
- DOI: https://dx.doi.org/10.4251/wjgo.v16.i8.3507


