Copyright
©The Author(s) 2024.
World J Gastrointest Oncol. Aug 15, 2024; 16(8): 3507-3520
Published online Aug 15, 2024. doi: 10.4251/wjgo.v16.i8.3507
Published online Aug 15, 2024. doi: 10.4251/wjgo.v16.i8.3507
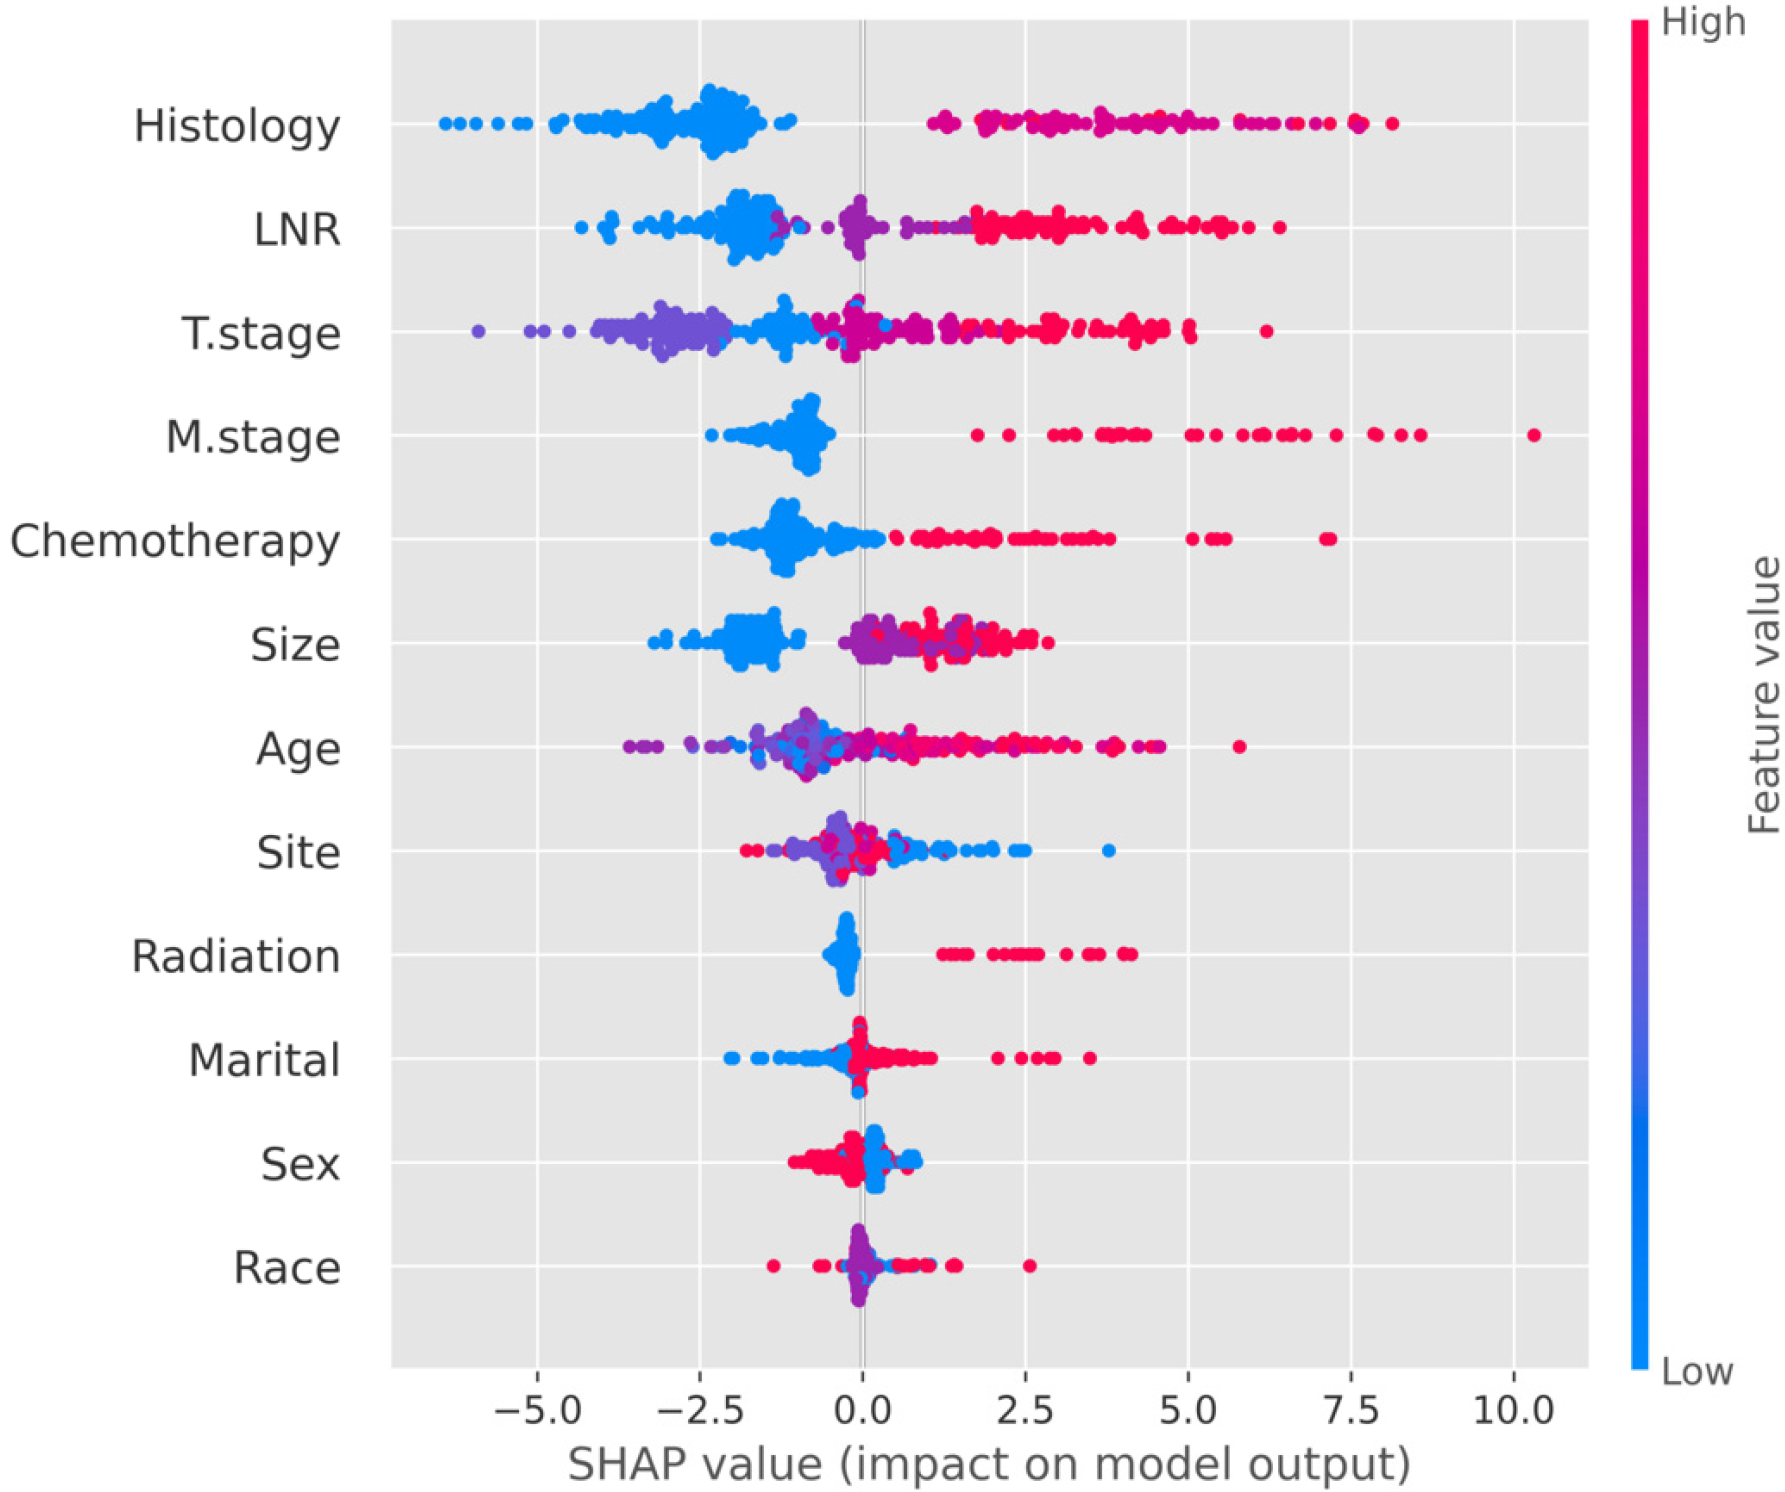
Figure 7 The SHapley Additive exPlanations plot of the random survival forest model.
A dot on the SHapley Additive exPlanations plot represents a sample. Y-axis variables are sorted according to the variables’ importance. The X-axis represents the influence of variables on the model output outcome. The left side of X = 0.0 represents the negative effect of variables on the outcome, and the right side of X = 0.0 represents the positive effect of variables on the outcome. Taking lymph node ratio as an example, the higher the lymph node ratio level, the worse the prognosis of patients. LNR: Lymph node ratio; SHAP: SHapley Additive exPlanations.
- Citation: Liu W, Wu HY, Lin JX, Qu ST, Gu YJ, Zhu JZ, Xu CF. Combining lymph node ratio to develop prognostic models for postoperative gastric neuroendocrine neoplasm patients. World J Gastrointest Oncol 2024; 16(8): 3507-3520
- URL: https://www.wjgnet.com/1948-5204/full/v16/i8/3507.htm
- DOI: https://dx.doi.org/10.4251/wjgo.v16.i8.3507


