Copyright
©The Author(s) 2024.
World J Gastrointest Oncol. Aug 15, 2024; 16(8): 3507-3520
Published online Aug 15, 2024. doi: 10.4251/wjgo.v16.i8.3507
Published online Aug 15, 2024. doi: 10.4251/wjgo.v16.i8.3507
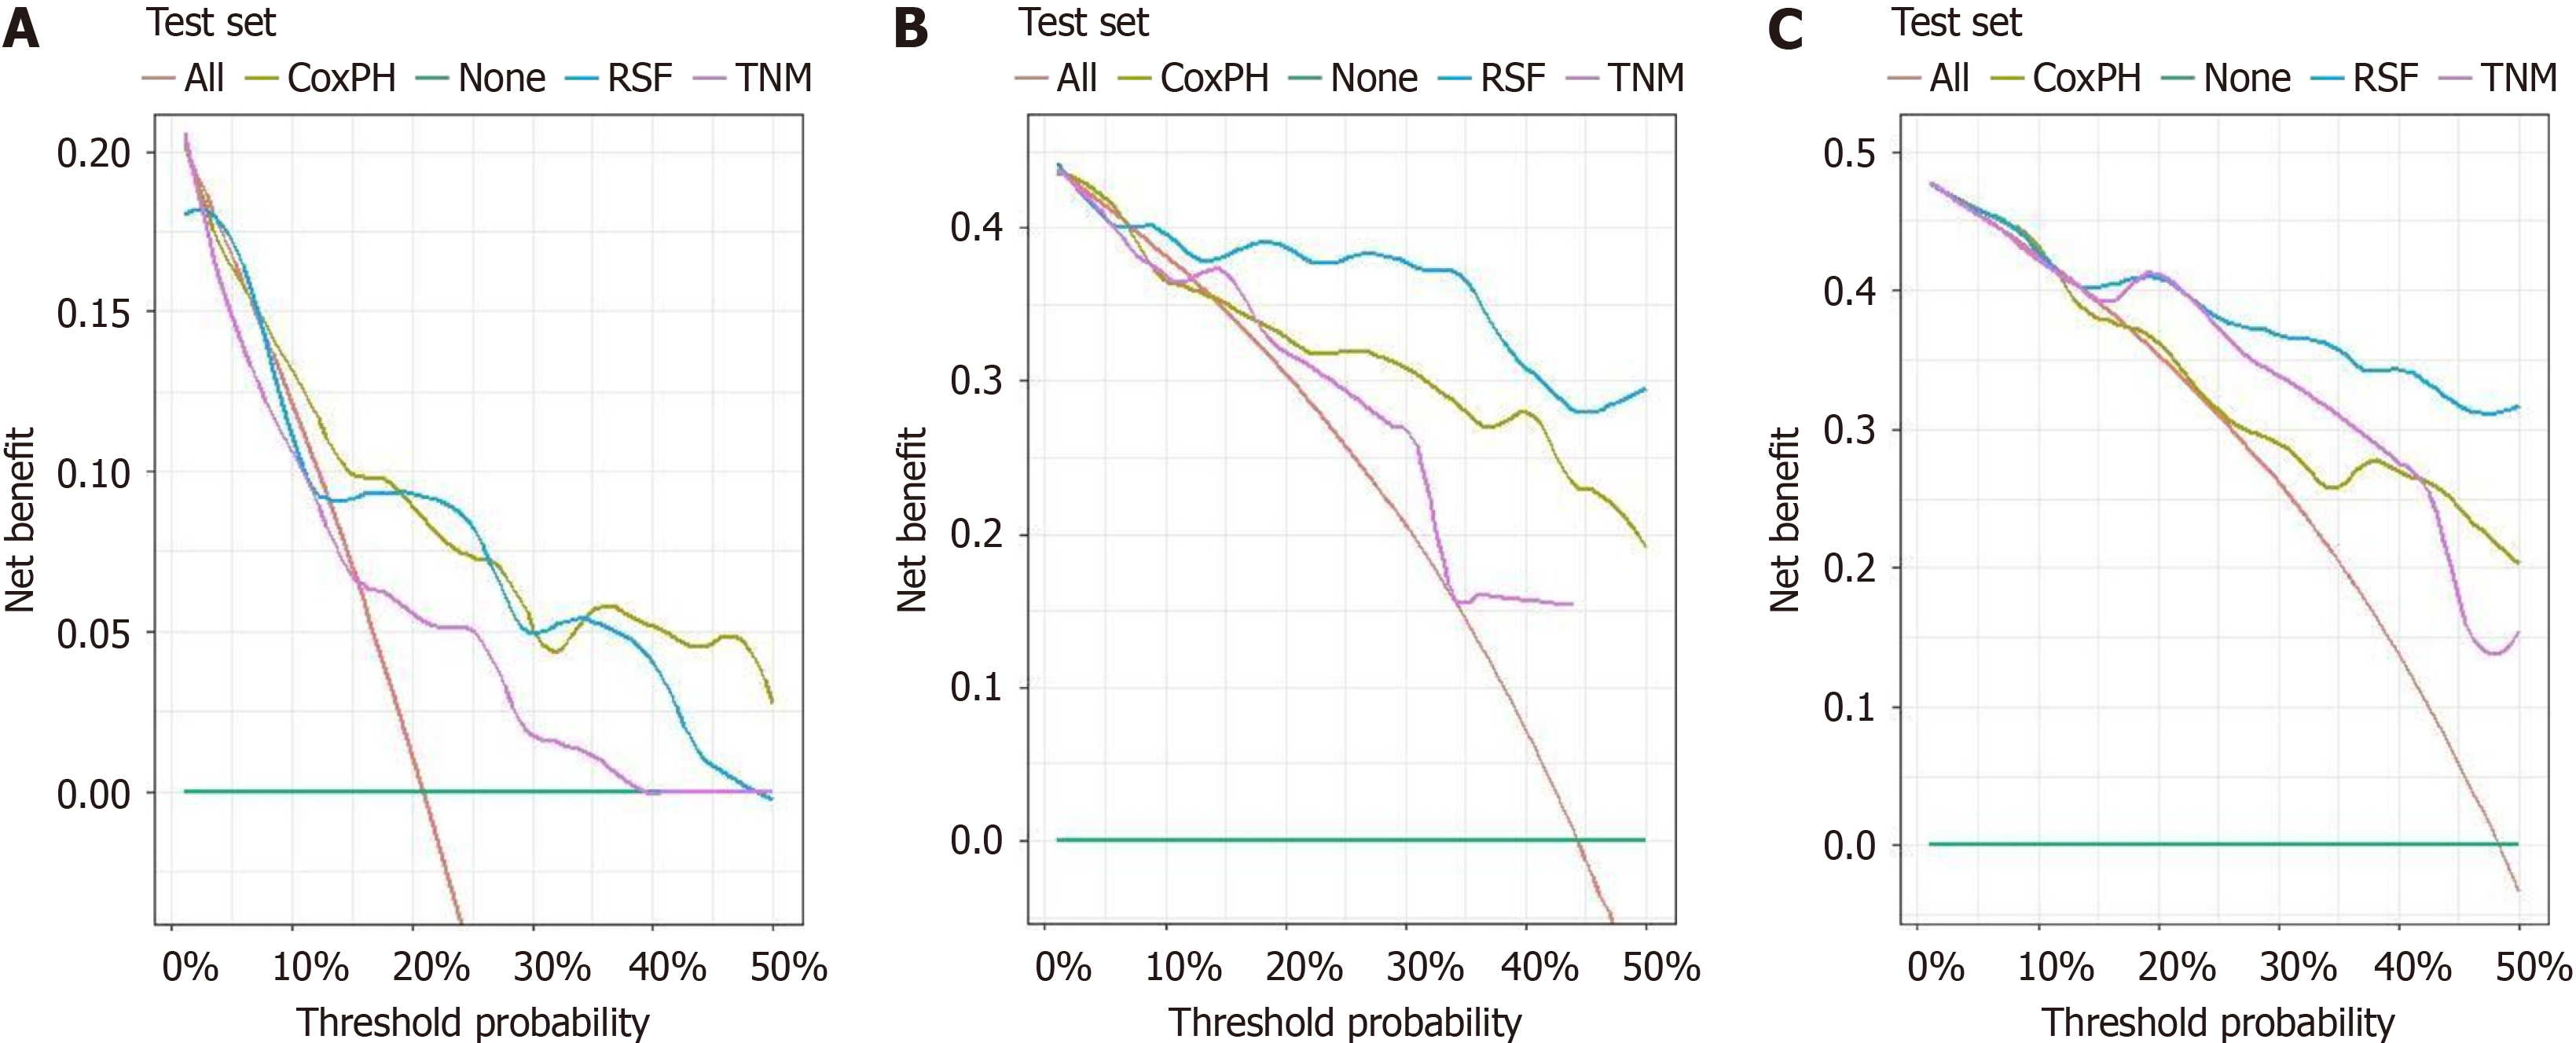
Figure 6 The 1-year, 3-year, and 5-year decision curve analysis curves for the American Joint Committee on Cancer tumor-node-metastasis staging, the Cox proportional hazards model, and the random survival forest model in the test set.
A: The 1-year decision curve analysis (DCA) curves; B: The 3-year DCA curves; C: The 5-year DCA curves. TNM: Tumor-node-metastasis; RSF: Random survival forest; CoxPH: Cox proportional hazards.
- Citation: Liu W, Wu HY, Lin JX, Qu ST, Gu YJ, Zhu JZ, Xu CF. Combining lymph node ratio to develop prognostic models for postoperative gastric neuroendocrine neoplasm patients. World J Gastrointest Oncol 2024; 16(8): 3507-3520
- URL: https://www.wjgnet.com/1948-5204/full/v16/i8/3507.htm
- DOI: https://dx.doi.org/10.4251/wjgo.v16.i8.3507


