Copyright
©The Author(s) 2024.
World J Gastrointest Oncol. Jul 15, 2024; 16(7): 3284-3298
Published online Jul 15, 2024. doi: 10.4251/wjgo.v16.i7.3284
Published online Jul 15, 2024. doi: 10.4251/wjgo.v16.i7.3284
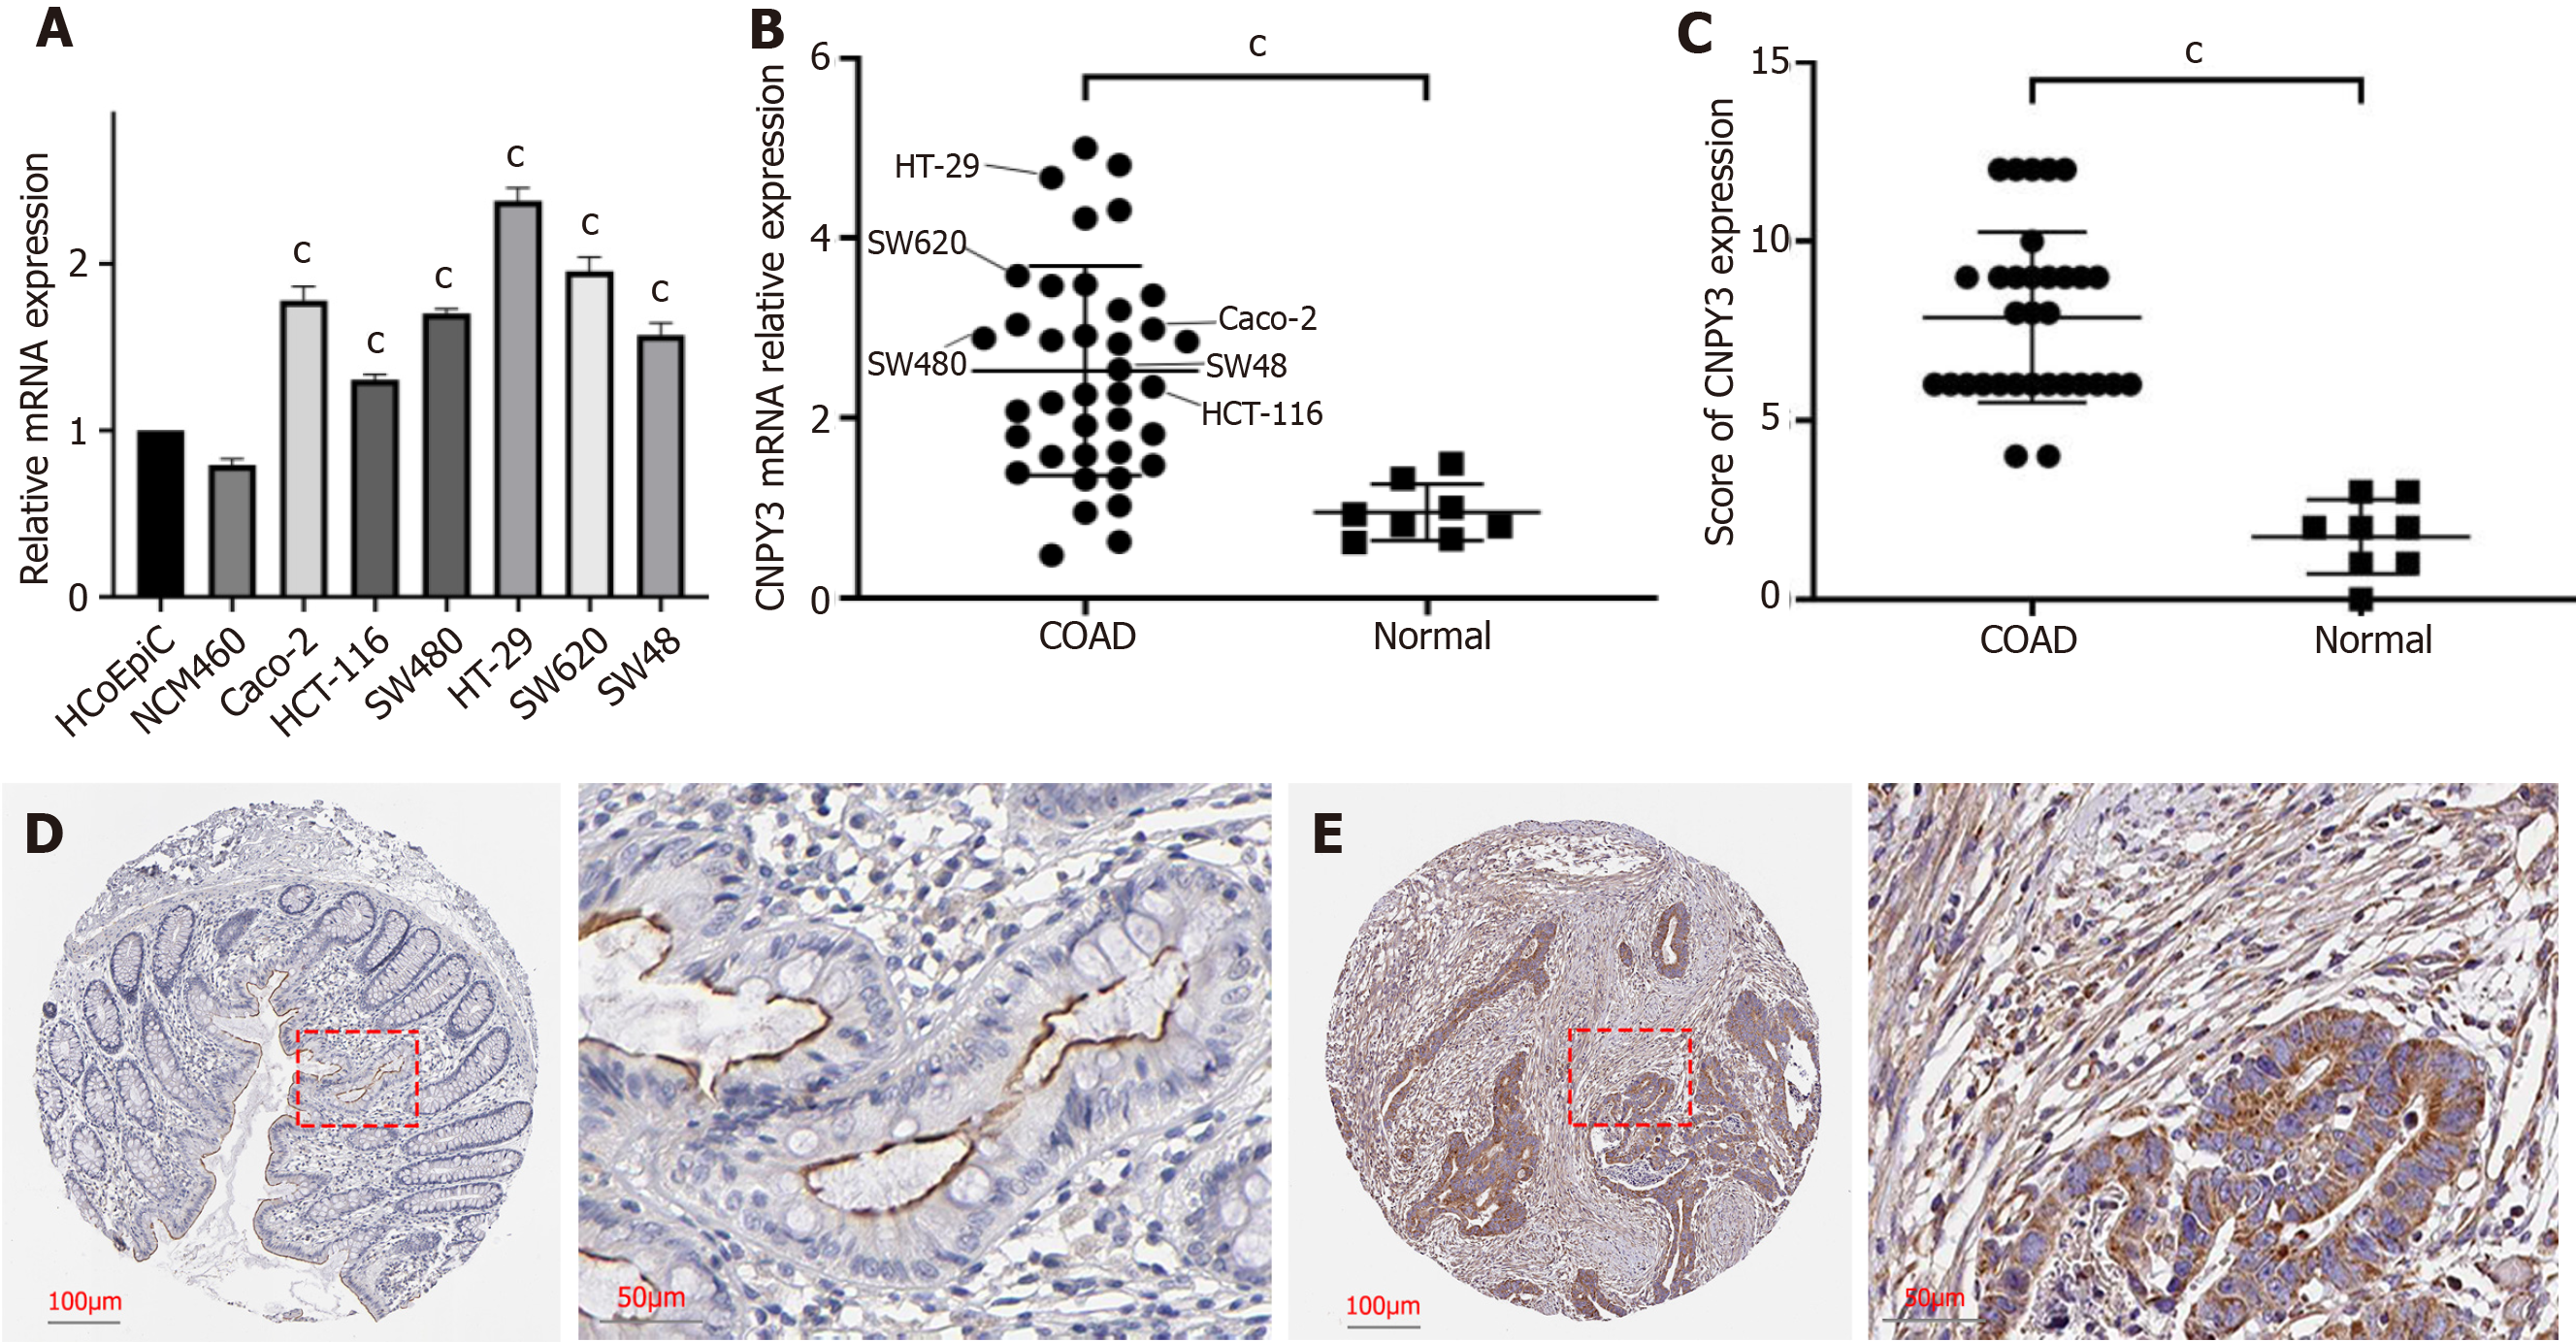
Figure 5 Validation of high canopy FGF signaling regulator 3 expression.
A: Relative mRNA expression levels of canopy FGF signaling regulator 3 (CNPY3) in normal (HCoEpiC and NCM460) and cancer cell lines (Caco-2, HCT-116, HT-29, SW48, SW480, and SW620); B: Relative mRNA expression levels of CNPY3 in normal tissue, tumor tissue, and tumor cell lines; C: Differences in immunohistochemical scores; D: Representative immunohistochemical staining images of normal tissue; E: Representative immunohistochemical staining images of tumor tissue. aP < 0.05; bP < 0.01, cP < 0.001. CNPY3: Canopy FGF signaling regulator 3; COAD: Colon adenocarcinoma.
- Citation: Gao XC, Zhou BH, Ji ZX, Li Q, Liu HN. Canopy FGF signaling regulator 3 affects prognosis, immune infiltration, and PI3K/AKT pathway in colon adenocarcinoma. World J Gastrointest Oncol 2024; 16(7): 3284-3298
- URL: https://www.wjgnet.com/1948-5204/full/v16/i7/3284.htm
- DOI: https://dx.doi.org/10.4251/wjgo.v16.i7.3284


