Copyright
©The Author(s) 2024.
World J Gastrointest Oncol. Jul 15, 2024; 16(7): 3284-3298
Published online Jul 15, 2024. doi: 10.4251/wjgo.v16.i7.3284
Published online Jul 15, 2024. doi: 10.4251/wjgo.v16.i7.3284
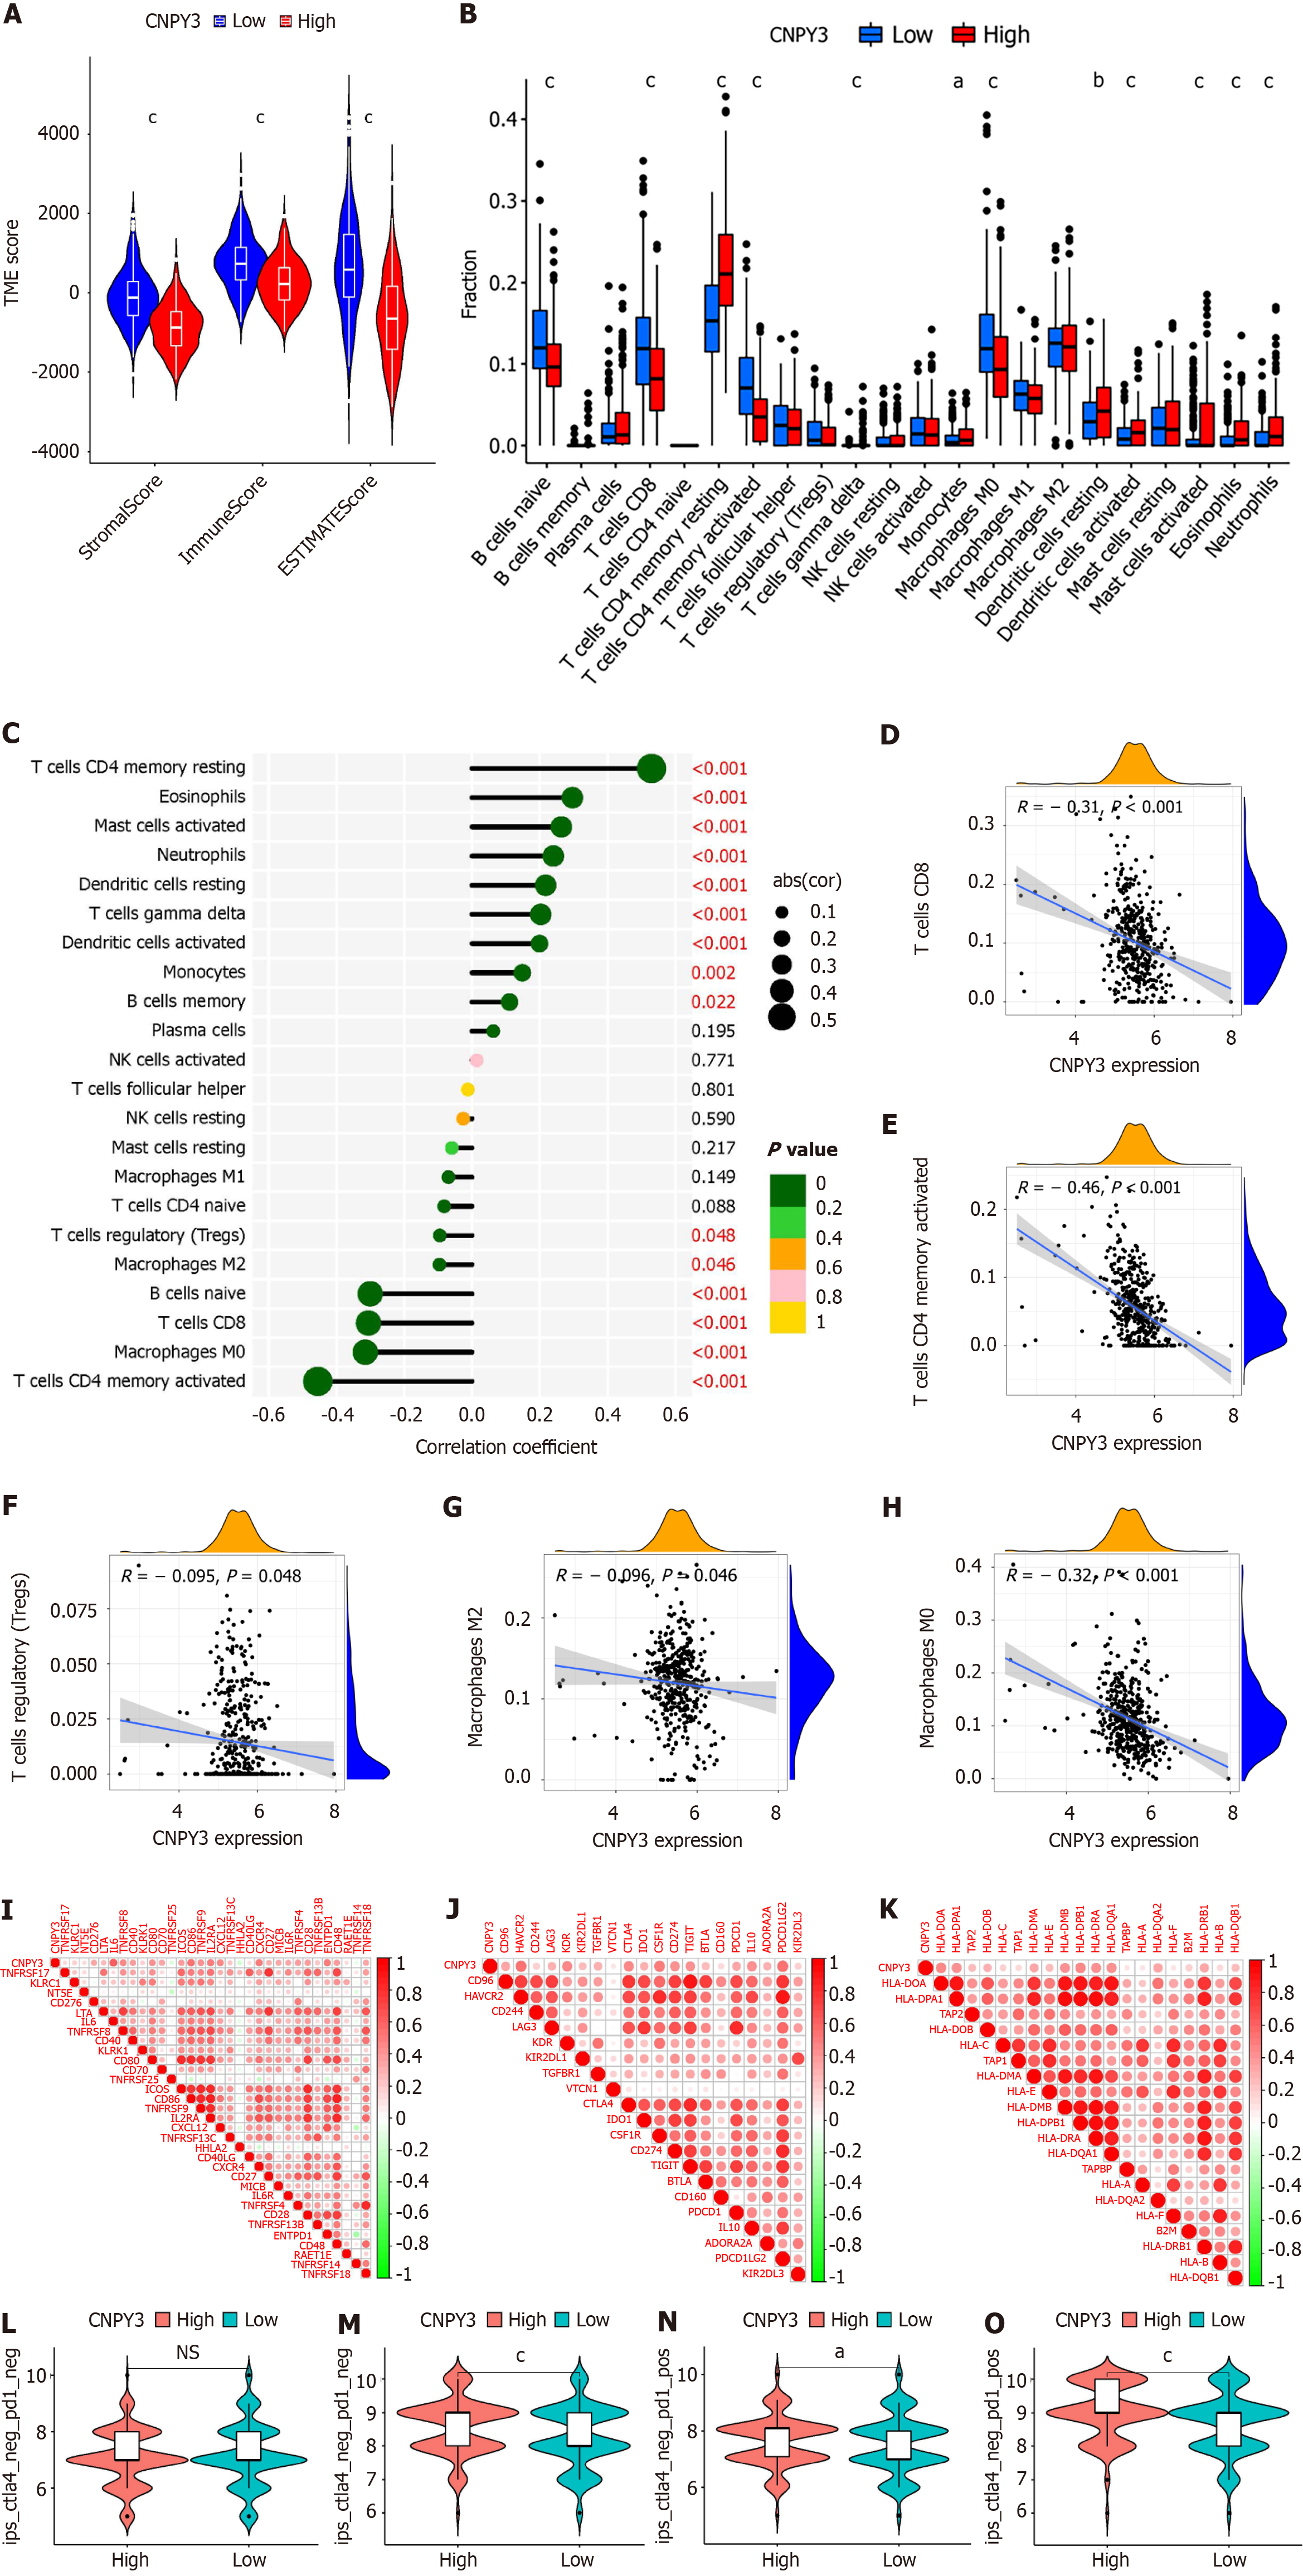
Figure 3 Immune correlation analysis.
A: Differences in immune microenvironment-related indexes (stomal, immune, and ESTIMATE scores); B: Differences in immune cell infiltration; C: Correlations between canopy FGF signaling regulator 3 (CNPY3) expression and immune cell infiltration; D-H: Correlations between CNPY3 expression and activated CD8+ T cells (D), CD4+ T cells (E), regulatory T cells (F), M2 macrophages (G), and M0 macrophages (H); I-K: Correlations between CNPY3 expression and expression of immunostimulatory factors (I), immune inhibitors (J), and MHC molecules (K); L-O: Patient response to immune checkpoint inhibitors. aP < 0.05; bP < 0.01, cP < 0.001, NS: Not significant; CNPY3: Canopy FGF signaling regulator 3.
- Citation: Gao XC, Zhou BH, Ji ZX, Li Q, Liu HN. Canopy FGF signaling regulator 3 affects prognosis, immune infiltration, and PI3K/AKT pathway in colon adenocarcinoma. World J Gastrointest Oncol 2024; 16(7): 3284-3298
- URL: https://www.wjgnet.com/1948-5204/full/v16/i7/3284.htm
- DOI: https://dx.doi.org/10.4251/wjgo.v16.i7.3284


