Copyright
©The Author(s) 2024.
World J Gastrointest Oncol. Jul 15, 2024; 16(7): 3284-3298
Published online Jul 15, 2024. doi: 10.4251/wjgo.v16.i7.3284
Published online Jul 15, 2024. doi: 10.4251/wjgo.v16.i7.3284
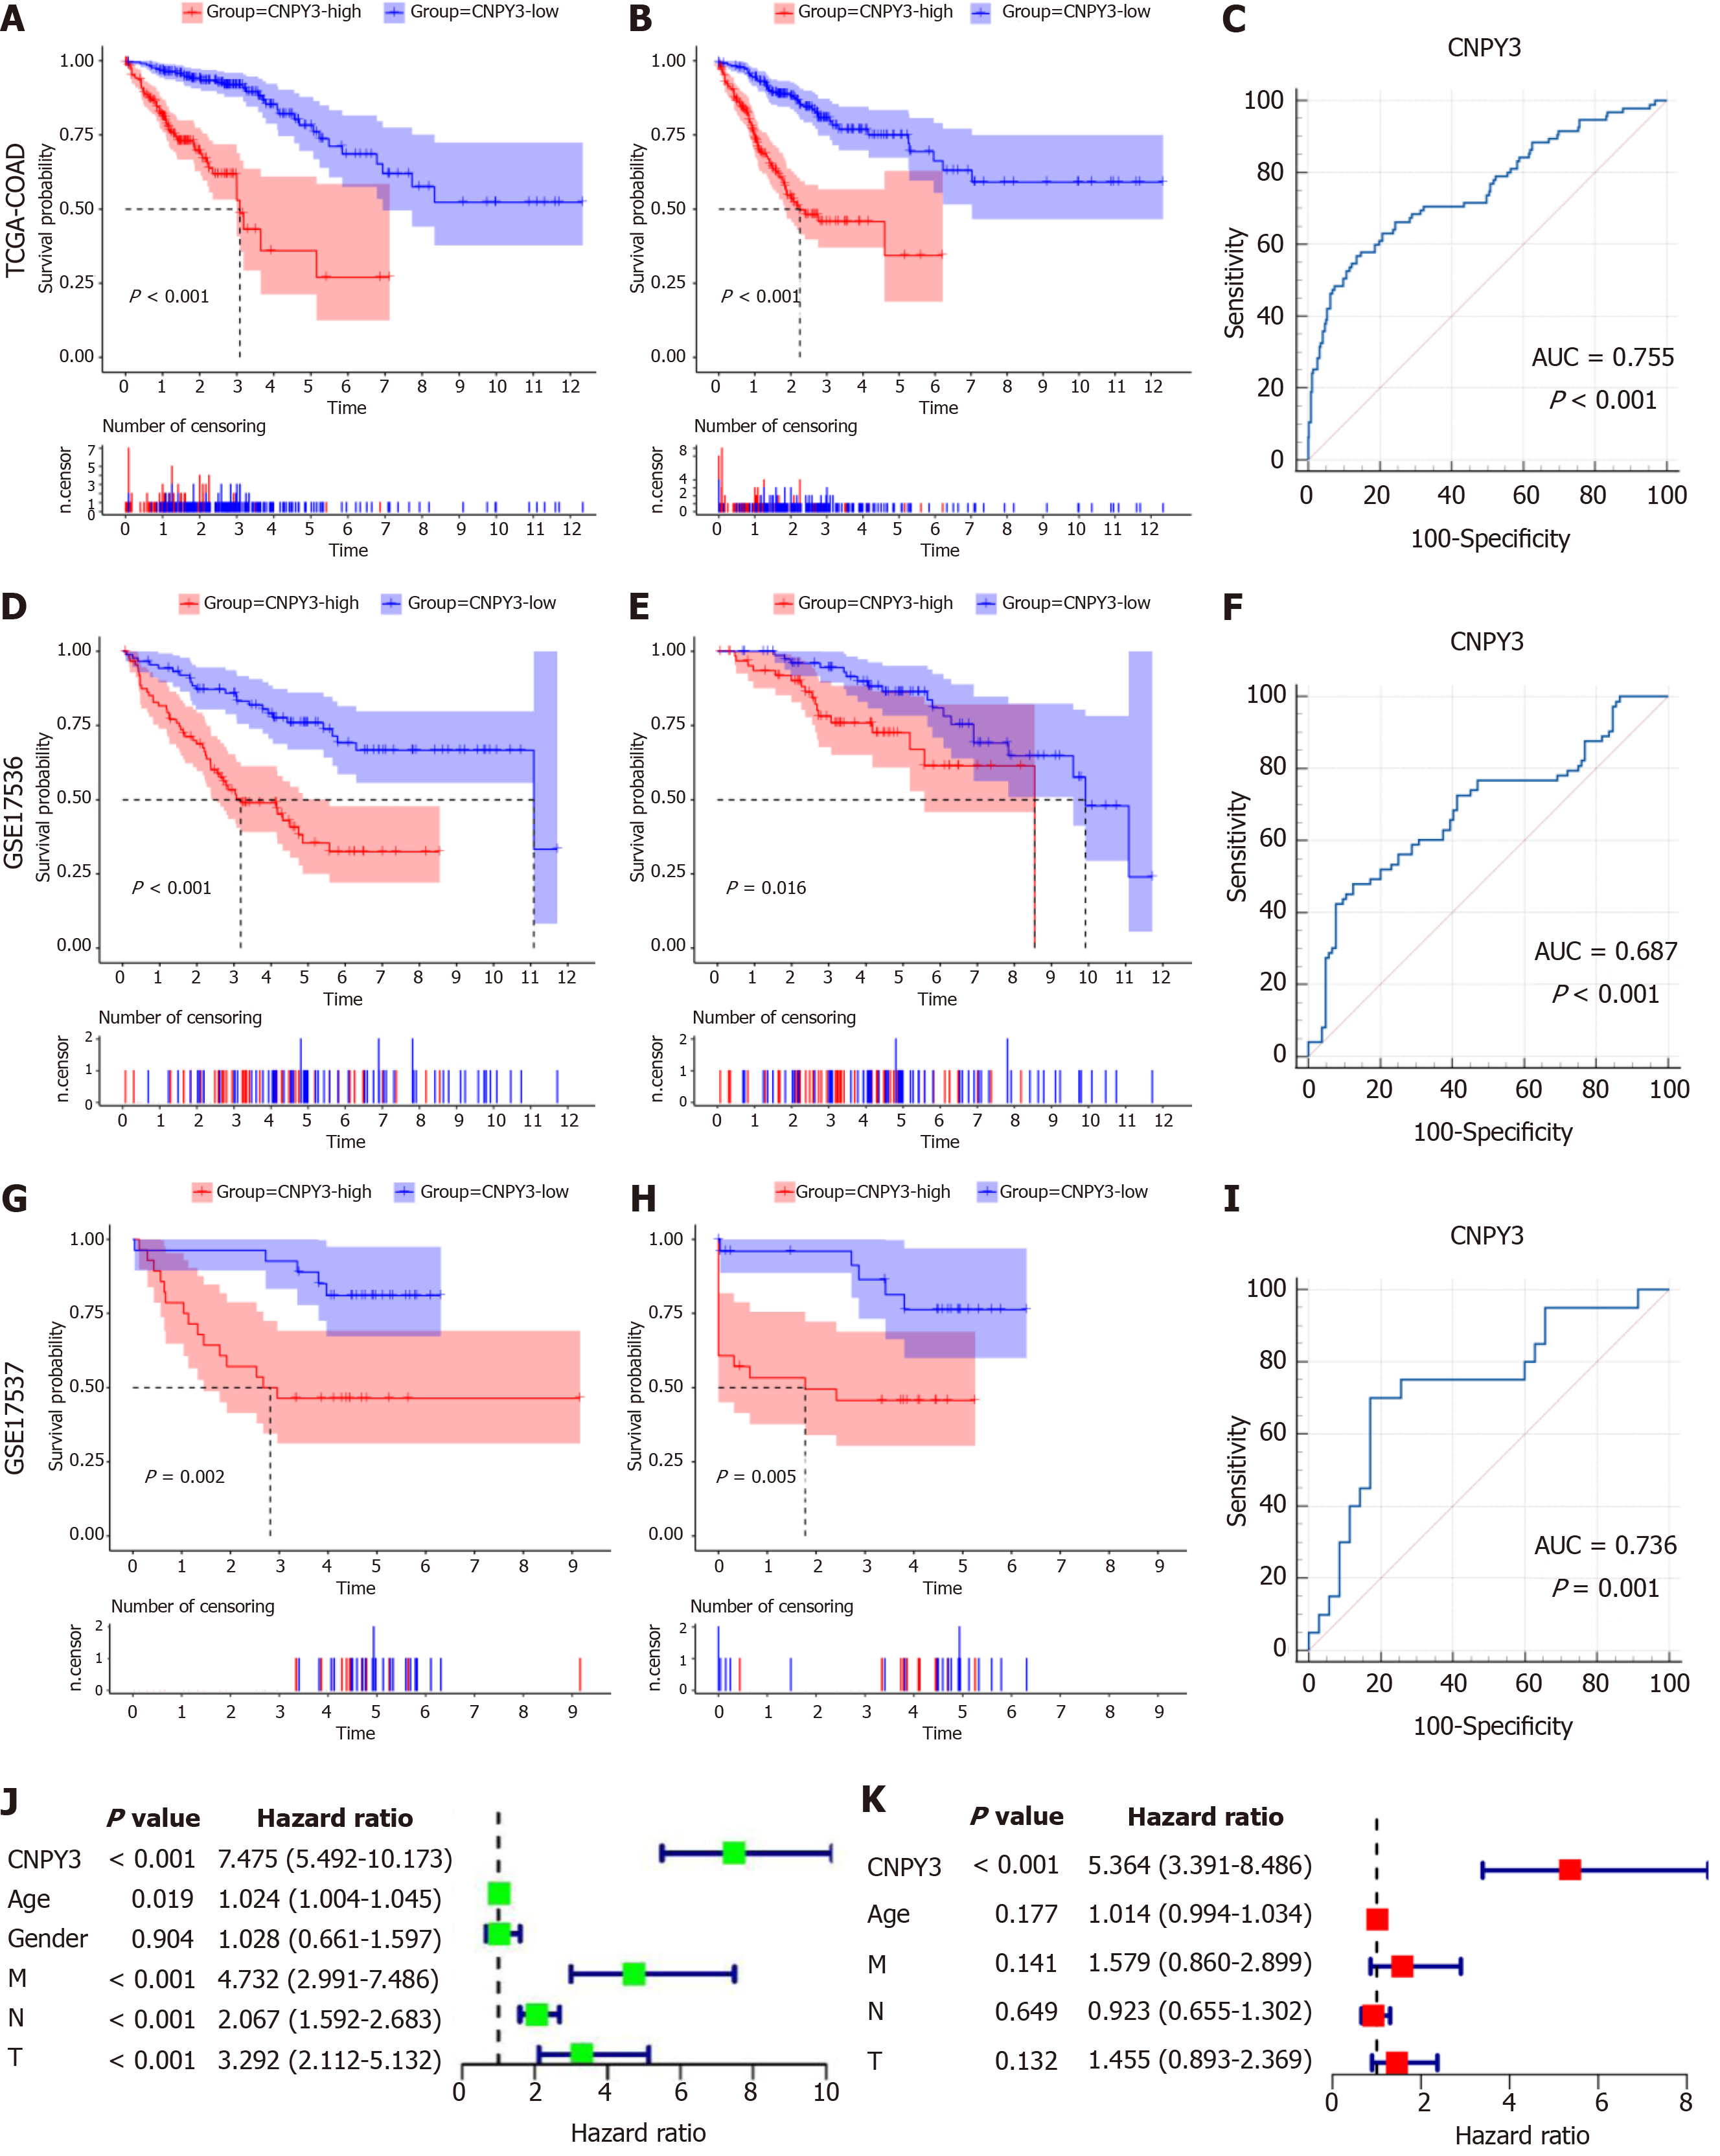
Figure 2 Prognostic analysis of canopy FGF signaling regulator 3.
A: Overall survival (OS) curve of Cancer Genome Atlas (TCGA)-colon adenocarcinoma (COAD) cohort; B: Progression-free survival (PFS) curve of TCGA-COAD cohort; C: Receiver operating characteristic (ROC) curve of TCGA-COAD cohort [area under curve (AUC) = 0.755]; D: OS curve of GSE17536 cohort; E: PFS curve of GSE17536 cohort; F: ROC curve of GSE17536 cohort (AUC = 0.687); G: OS curve of GSE17537 cohort; H: PFS curve of GSE17537 cohort; I: ROC curve of GSE17537 cohort (AUC = 0.736); J: Univariate regression analysis; K: Multivariate regression analysis. CNPY3: Canopy FGF signaling regulator 3; TCGA: The Cancer Genome Atlas; COAD: Colon adenocarcinoma; GTEx: Genotype Tissue Expression.
- Citation: Gao XC, Zhou BH, Ji ZX, Li Q, Liu HN. Canopy FGF signaling regulator 3 affects prognosis, immune infiltration, and PI3K/AKT pathway in colon adenocarcinoma. World J Gastrointest Oncol 2024; 16(7): 3284-3298
- URL: https://www.wjgnet.com/1948-5204/full/v16/i7/3284.htm
- DOI: https://dx.doi.org/10.4251/wjgo.v16.i7.3284


