Copyright
©The Author(s) 2024.
World J Gastrointest Oncol. Jul 15, 2024; 16(7): 3193-3210
Published online Jul 15, 2024. doi: 10.4251/wjgo.v16.i7.3193
Published online Jul 15, 2024. doi: 10.4251/wjgo.v16.i7.3193
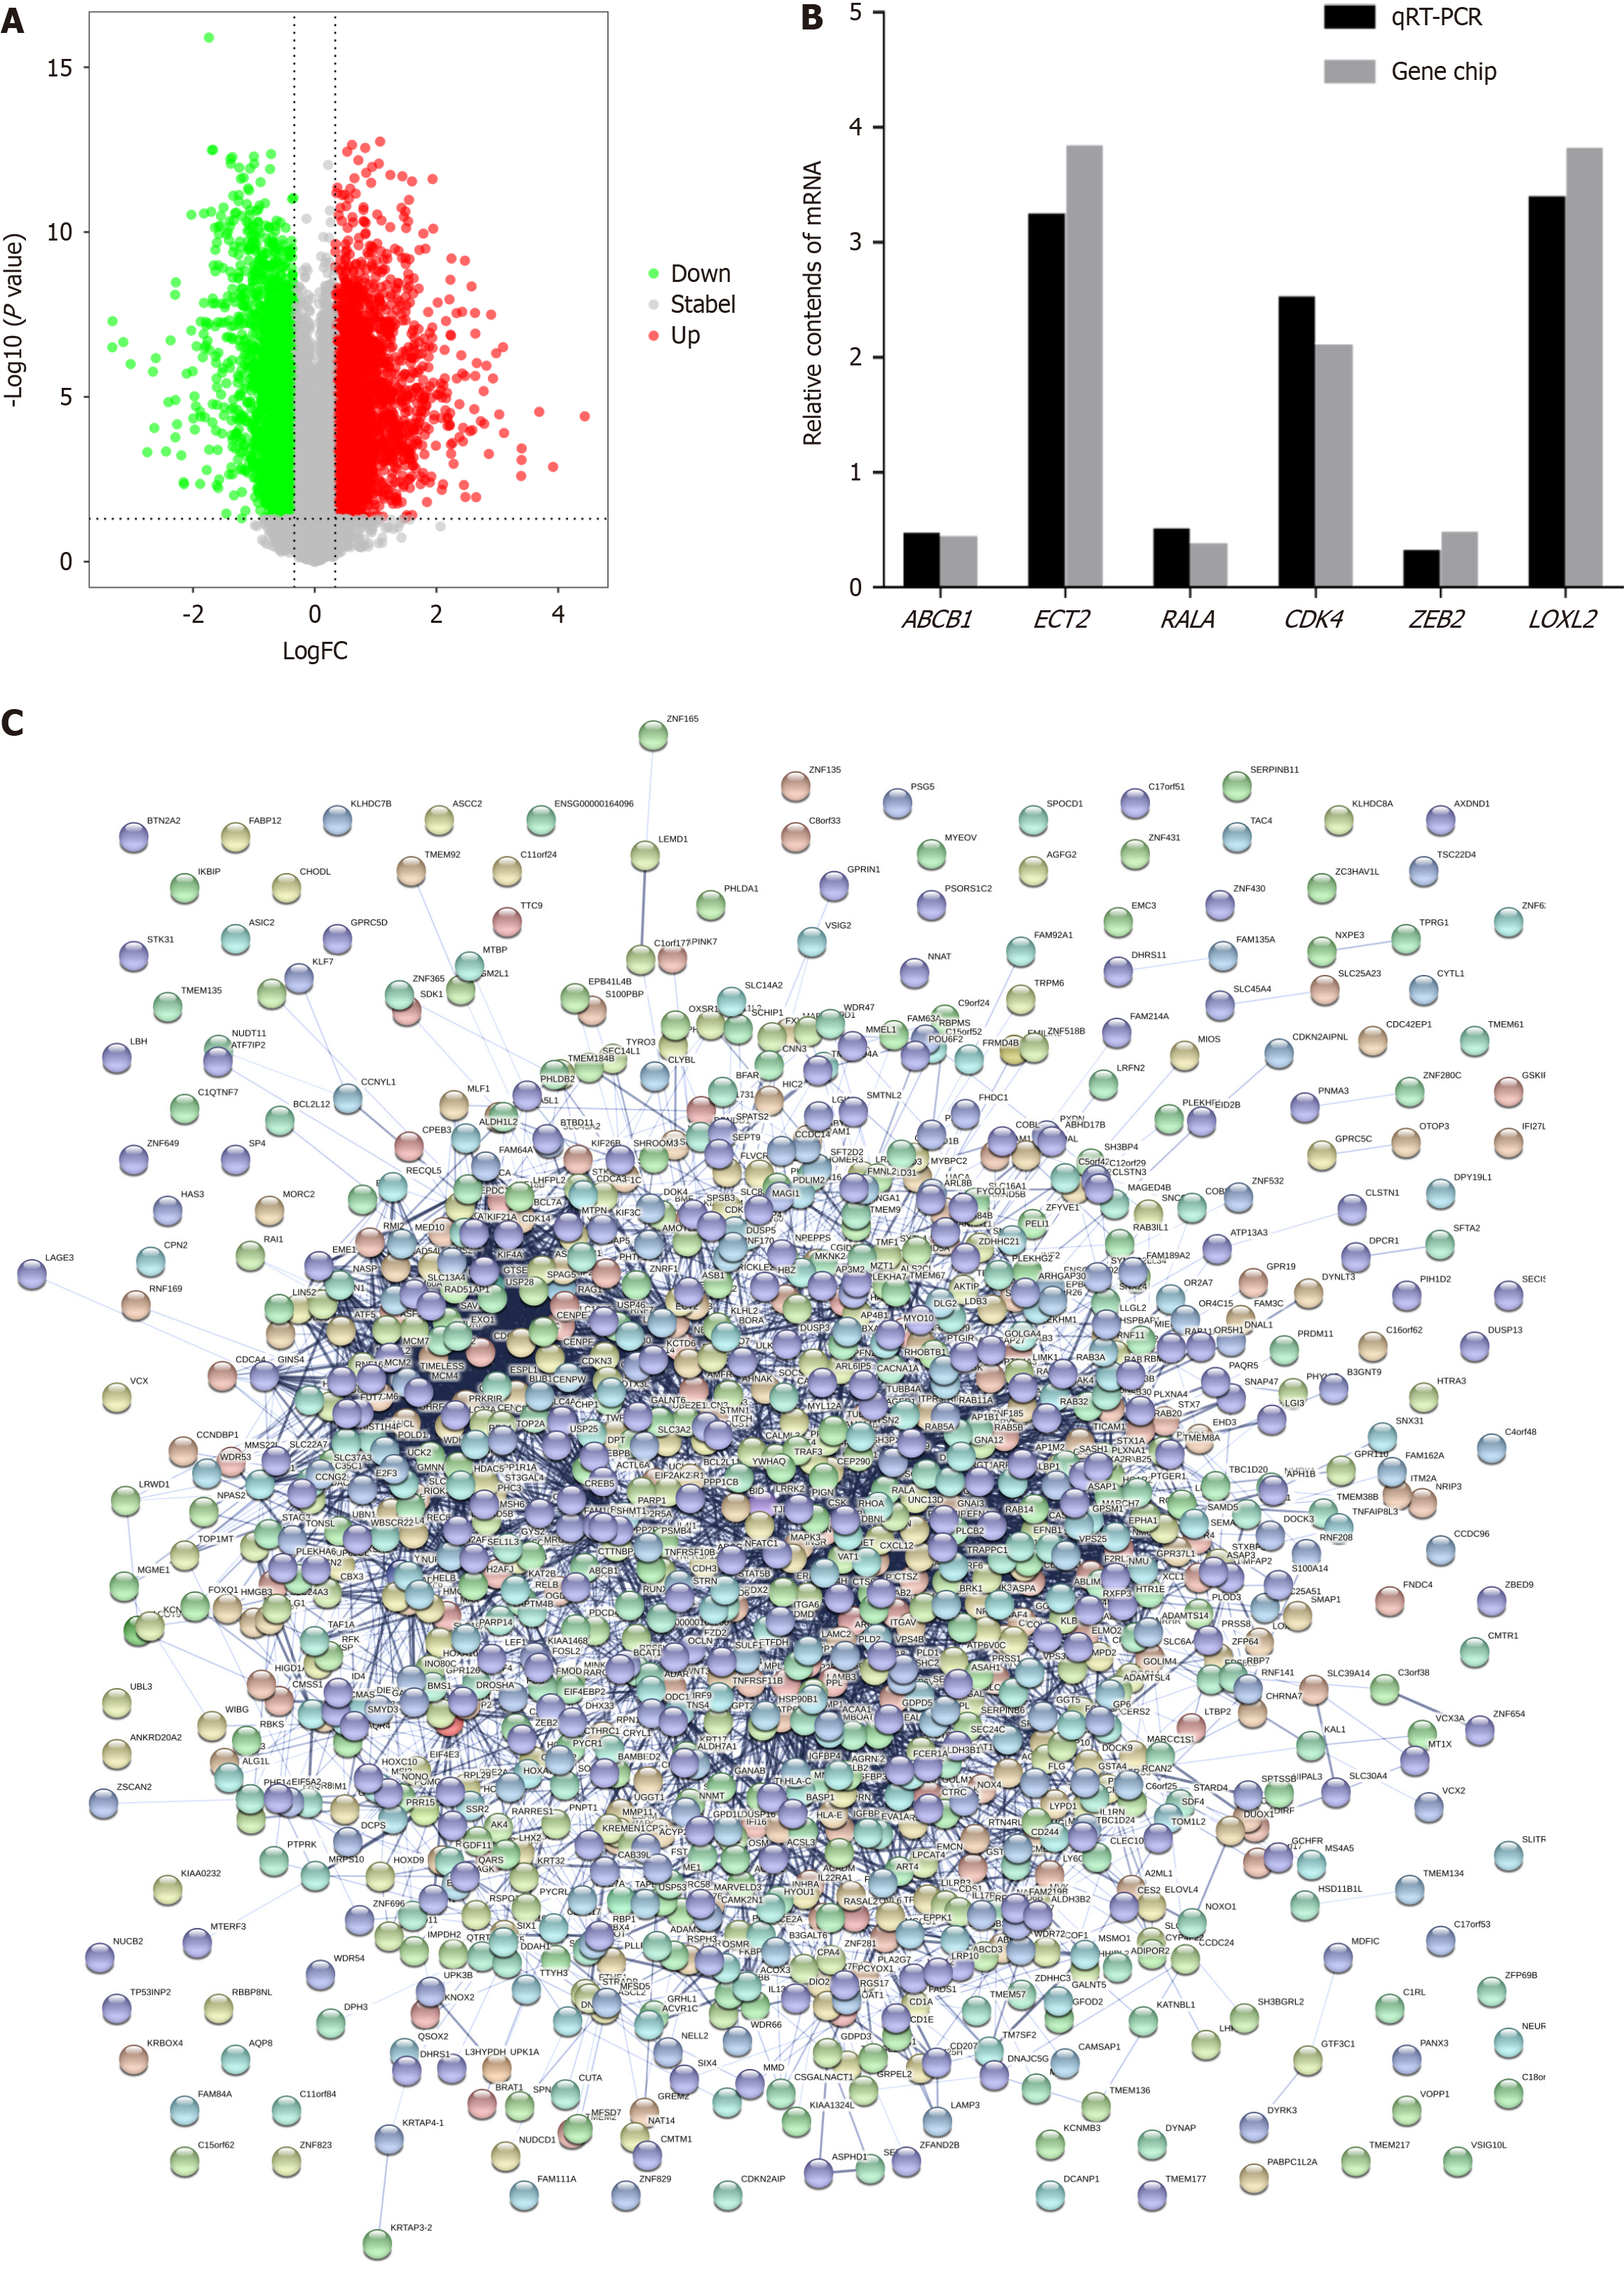
Figure 1 Analysis of differentially expressed genes.
A: Volcanic map of differentially expressed genes (DEGs). Red, upregulated; green, downregulated; gray, no significant difference; B: Correlation between genes detected by gene chip and qRT-PCR; C: Protein-protein interaction network for DEGs.
- Citation: Yang H, Chen XW, Song XJ, Du HY, Si FC. Baitouweng decoction suppresses growth of esophageal carcinoma cells through miR-495-3p/BUB1/STAT3 axis. World J Gastrointest Oncol 2024; 16(7): 3193-3210
- URL: https://www.wjgnet.com/1948-5204/full/v16/i7/3193.htm
- DOI: https://dx.doi.org/10.4251/wjgo.v16.i7.3193


