Copyright
©The Author(s) 2024.
World J Gastrointest Oncol. Jul 15, 2024; 16(7): 3169-3192
Published online Jul 15, 2024. doi: 10.4251/wjgo.v16.i7.3169
Published online Jul 15, 2024. doi: 10.4251/wjgo.v16.i7.3169
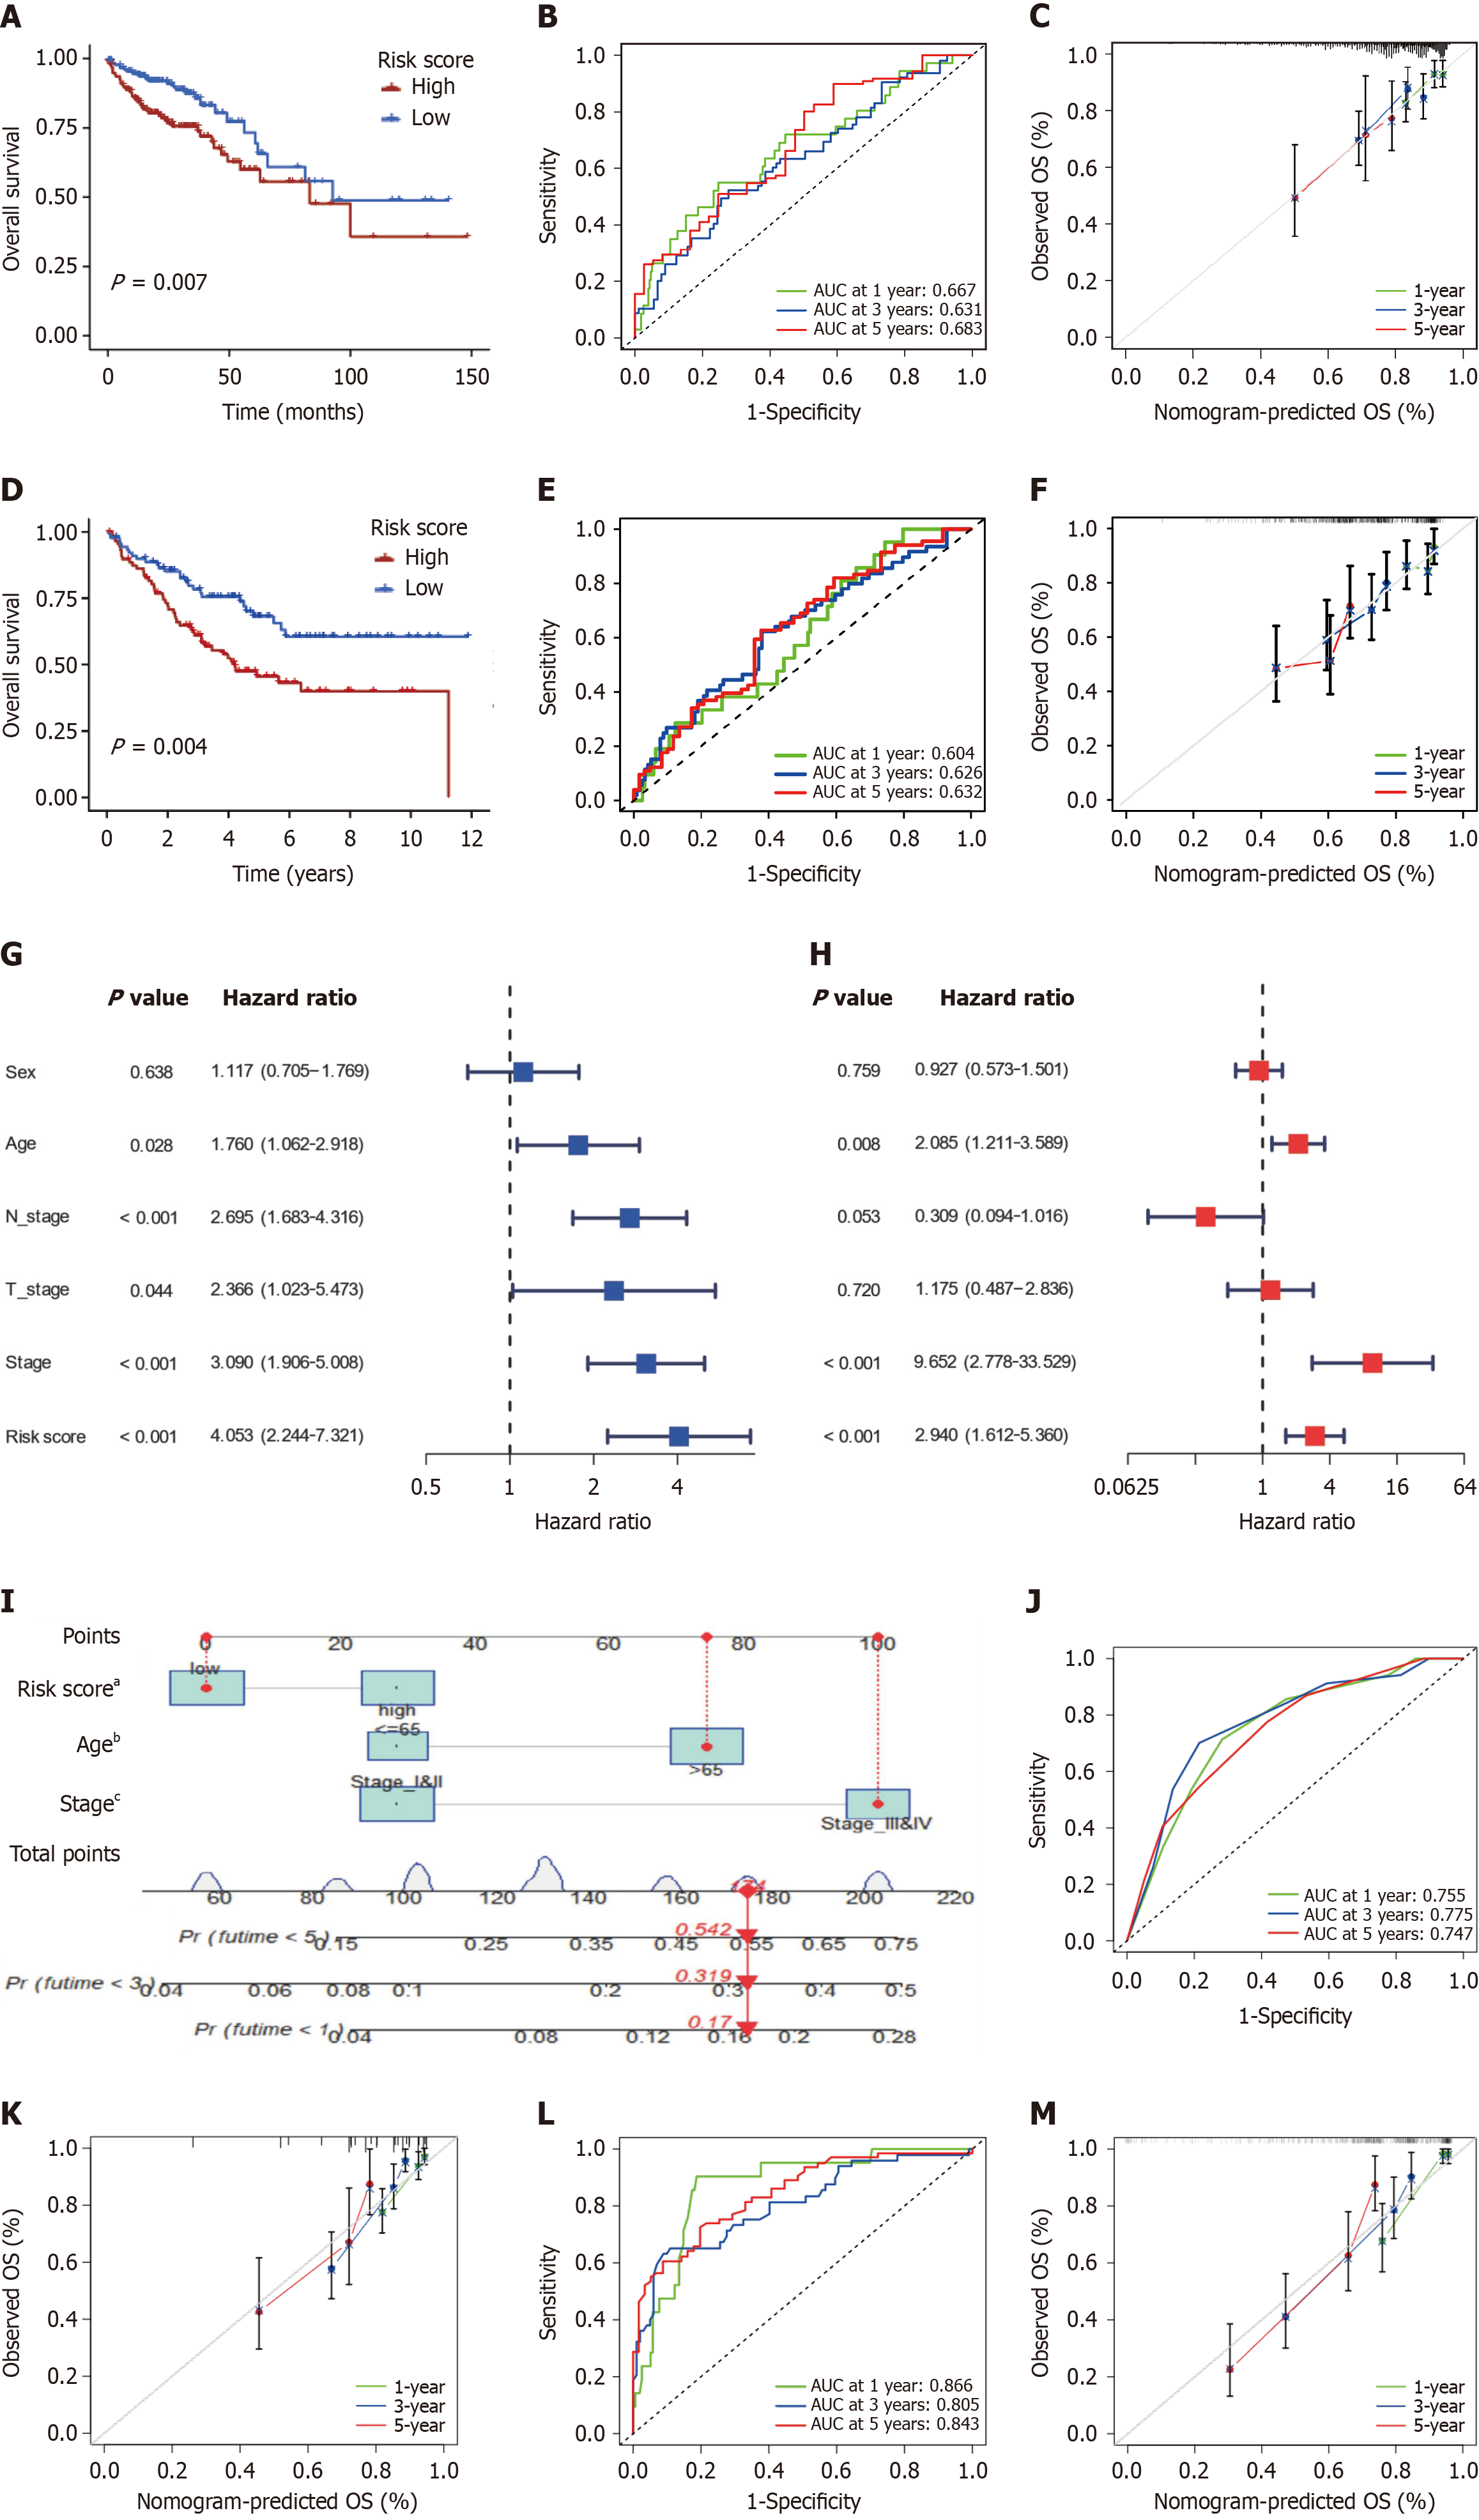
Figure 10 Construction, Internal, and validation of the angiogenesis-related signature model and the Nomogram.
A: Survival analyses for low and high angiogenesis-related signature (ARS) groups in The Cancer Genome Atlas Colon Adenocarcinoma (TCGA-COAD) cohort using Kaplan-Meier curves (P = 0.007); B: Time-dependent receiver operator characteristic (ROC) curves for ARS in the TCGA-COAD cohort; C: Calibration plots for ARS in the TCGA-COAD cohort; D: Survival analyses for low and high ARS groups in the GSE17536 cohort (P = 0.004); E: Time-dependent ROC curves for the ARS in the GSE17536 cohort; F: Calibration plots for the ARS in the GSE17536 cohort; G and H: Univariate and Multivariate Cox regression analysis of clinicopathological features and the ARS; I: Nomogram based on ARS, age, and tumor stage for predicting overall survival; J and K: Time-dependent ROC curves and calibration plot for nomogram in TCGA cohort; L and M: Time-dependent ROC and calibration plot curves for nomogram in GSE17536 cohort. AUC: Area under the curve. aP < 0.05; bP < 0.01; cP < 0.001.
- Citation: Yang Y, Qiu YT, Li WK, Cui ZL, Teng S, Wang YD, Wu J. Multi-Omics analysis elucidates tumor microenvironment and intratumor microbes of angiogenesis subtypes in colon cancer. World J Gastrointest Oncol 2024; 16(7): 3169-3192
- URL: https://www.wjgnet.com/1948-5204/full/v16/i7/3169.htm
- DOI: https://dx.doi.org/10.4251/wjgo.v16.i7.3169


