Copyright
©The Author(s) 2024.
World J Gastrointest Oncol. Jul 15, 2024; 16(7): 3169-3192
Published online Jul 15, 2024. doi: 10.4251/wjgo.v16.i7.3169
Published online Jul 15, 2024. doi: 10.4251/wjgo.v16.i7.3169
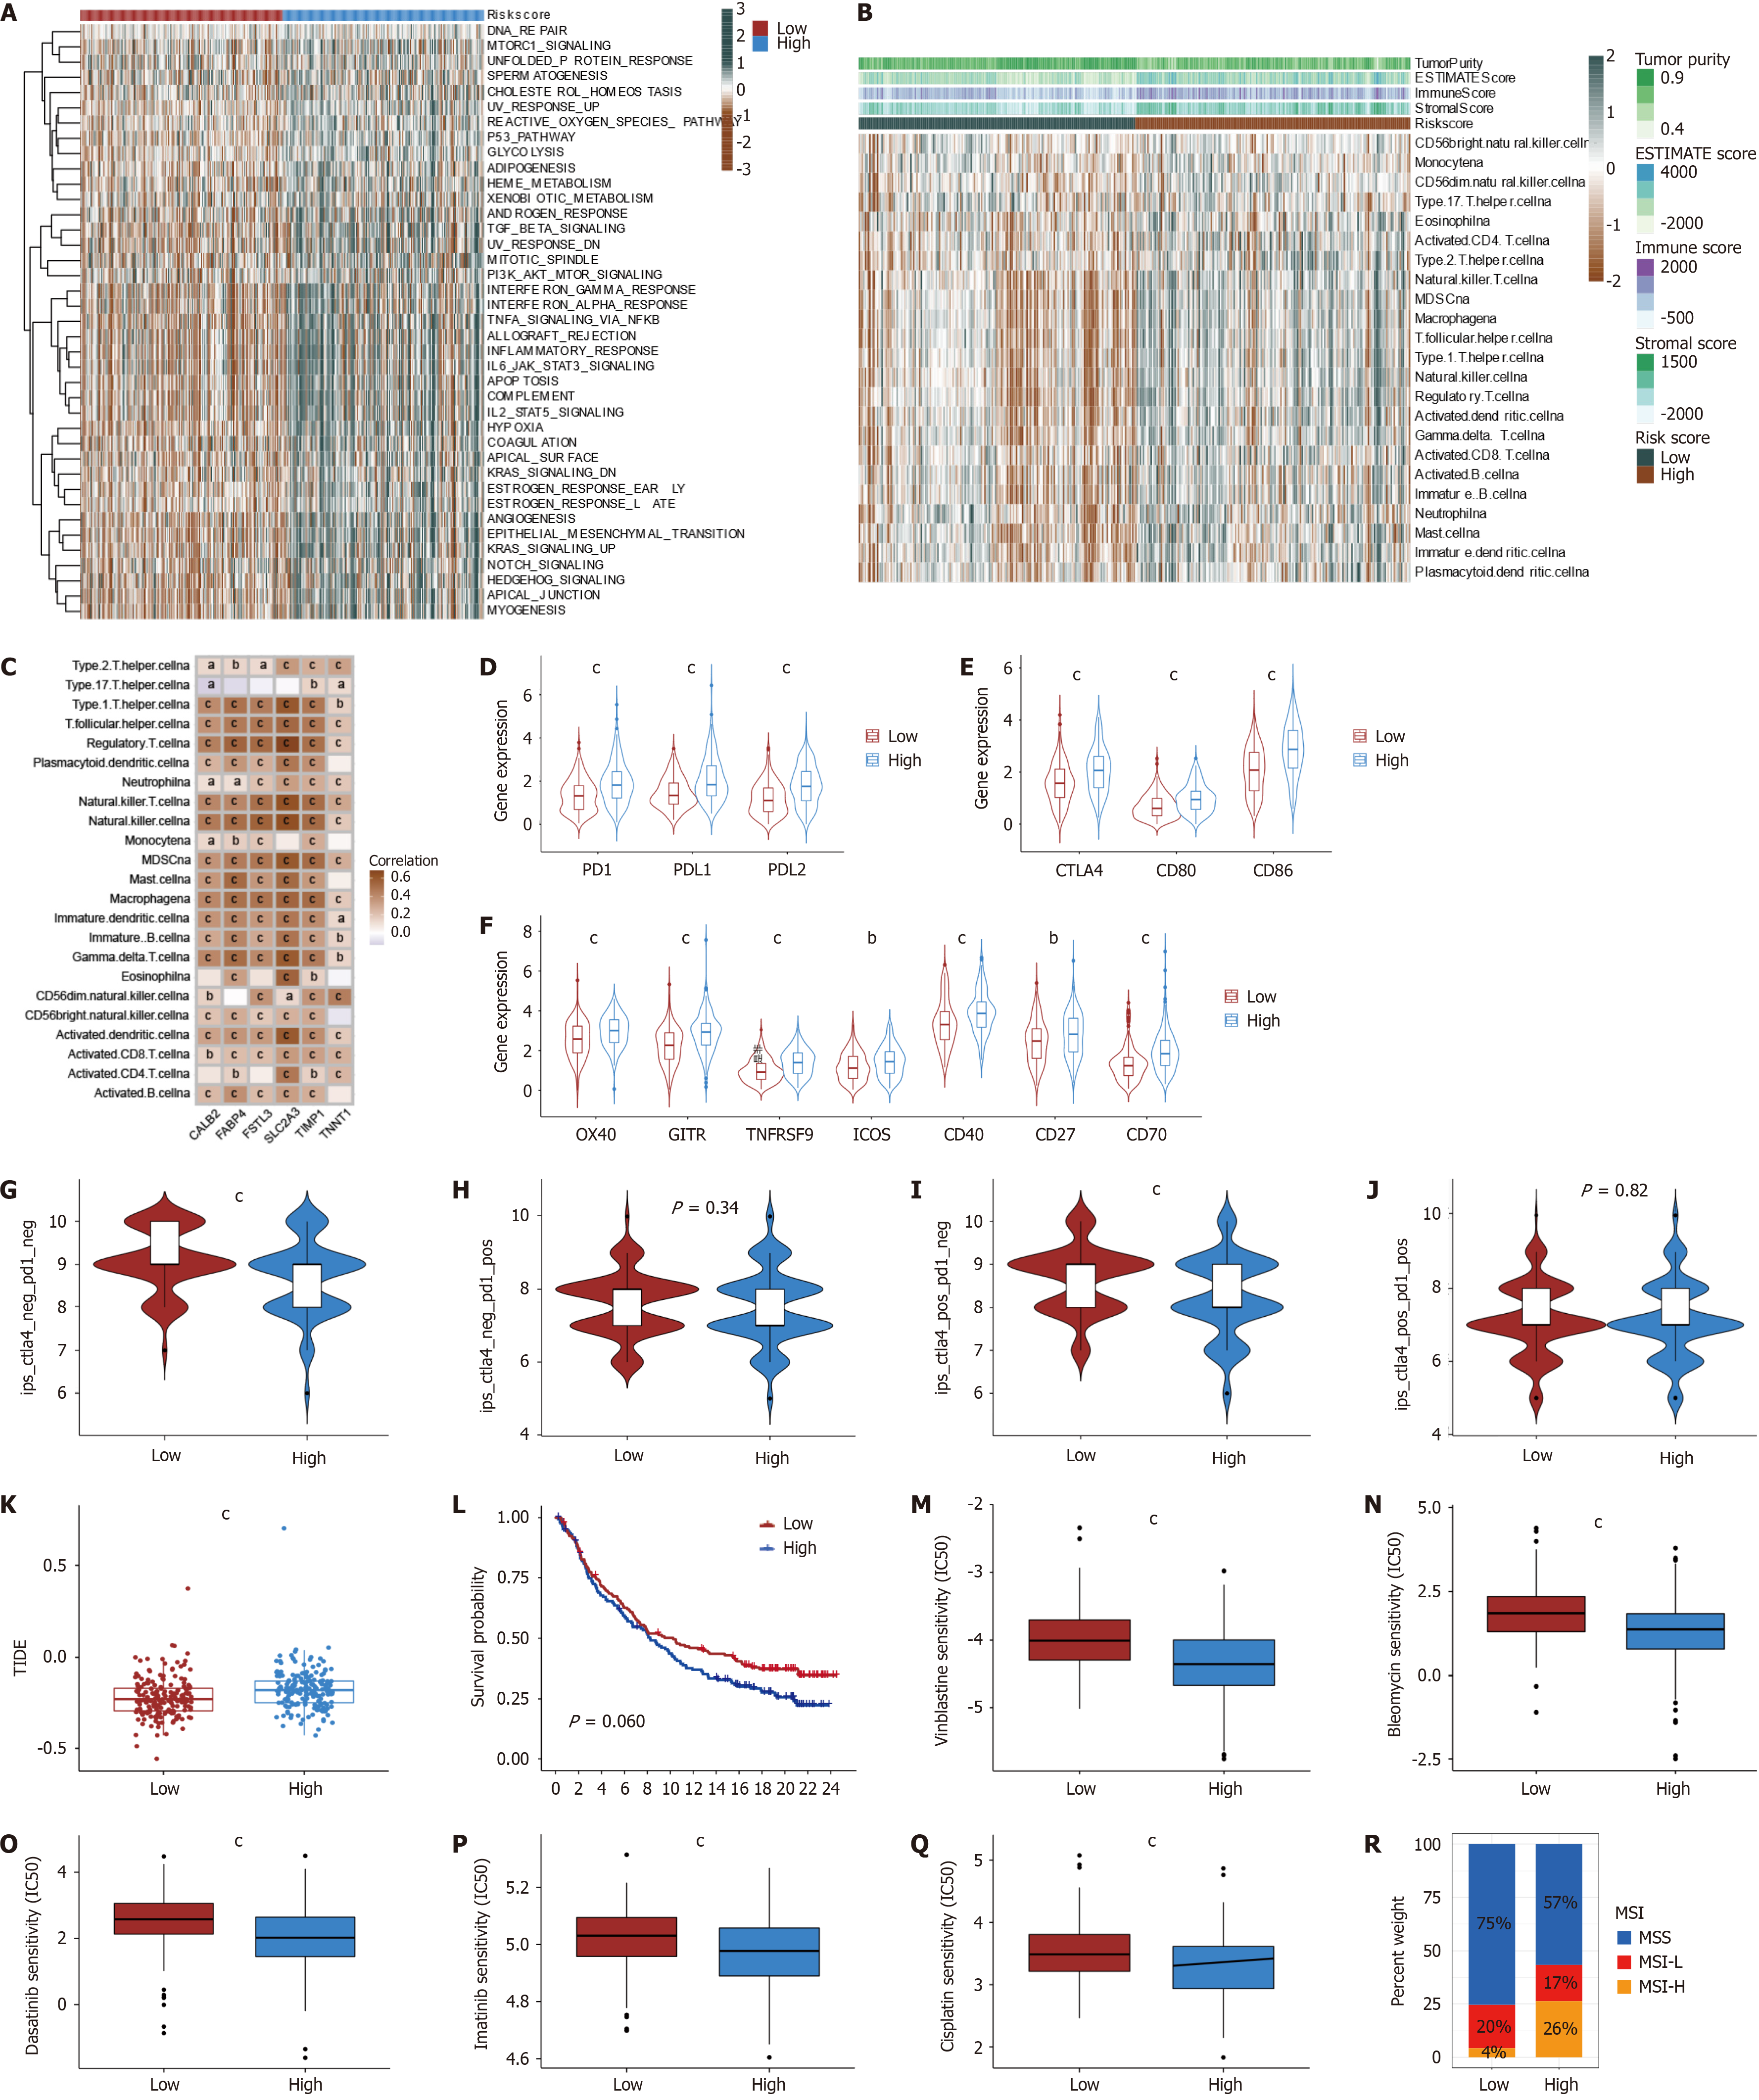
Figure 9 Identification of characterization, the abundance of immune cells, immune checkpoint, and immunotherapy effect between low and high-risk angiogenesis-related signature groups.
A: The heatmap showed the differences in HALLMARKER pathway single-sample gene set enrichment analysis scores between the two angiogenesis-related signature (ARS) groups; B: Differences in the abundance of immune cells between two ARS groups; C: Correlations between the abundance of immune cells and selected 6 genes in the ARS model; D: Differences in PD-1, PD-L1, and PD-L2 expression between two ARS groups (P < 0.001); E: Differences in CTLA4, CD80, and CD86 expression between two ARS groups (P < 0.001); F: Differences in OX40, GITR, TNFRSF9, ICOS, CD40, CD27, CD70 expression between two ARS groups (P < 0.001); G-J: Immunopheno score in two groups; K: Tumor immune dysfunction and Exclusion in two ARS groups; L: Survival analyses for two ARS groups in the anti-PD-L1 immunotherapy cohort using Kaplan-Meier curves (IMvigor210 cohort, P = 0.060); M-Q: Relationships between ARS groups and chemotherapeutic sensitivity; R: The proportion of high and low ARS groups in the three modification patterns. Microsatellite stability, blue; microsatellite instability-low red; microsatellite instability-high orange. aP < 0.05; bP < 0.01; cP < 0.001.
- Citation: Yang Y, Qiu YT, Li WK, Cui ZL, Teng S, Wang YD, Wu J. Multi-Omics analysis elucidates tumor microenvironment and intratumor microbes of angiogenesis subtypes in colon cancer. World J Gastrointest Oncol 2024; 16(7): 3169-3192
- URL: https://www.wjgnet.com/1948-5204/full/v16/i7/3169.htm
- DOI: https://dx.doi.org/10.4251/wjgo.v16.i7.3169


