Copyright
©The Author(s) 2024.
World J Gastrointest Oncol. Jul 15, 2024; 16(7): 3169-3192
Published online Jul 15, 2024. doi: 10.4251/wjgo.v16.i7.3169
Published online Jul 15, 2024. doi: 10.4251/wjgo.v16.i7.3169
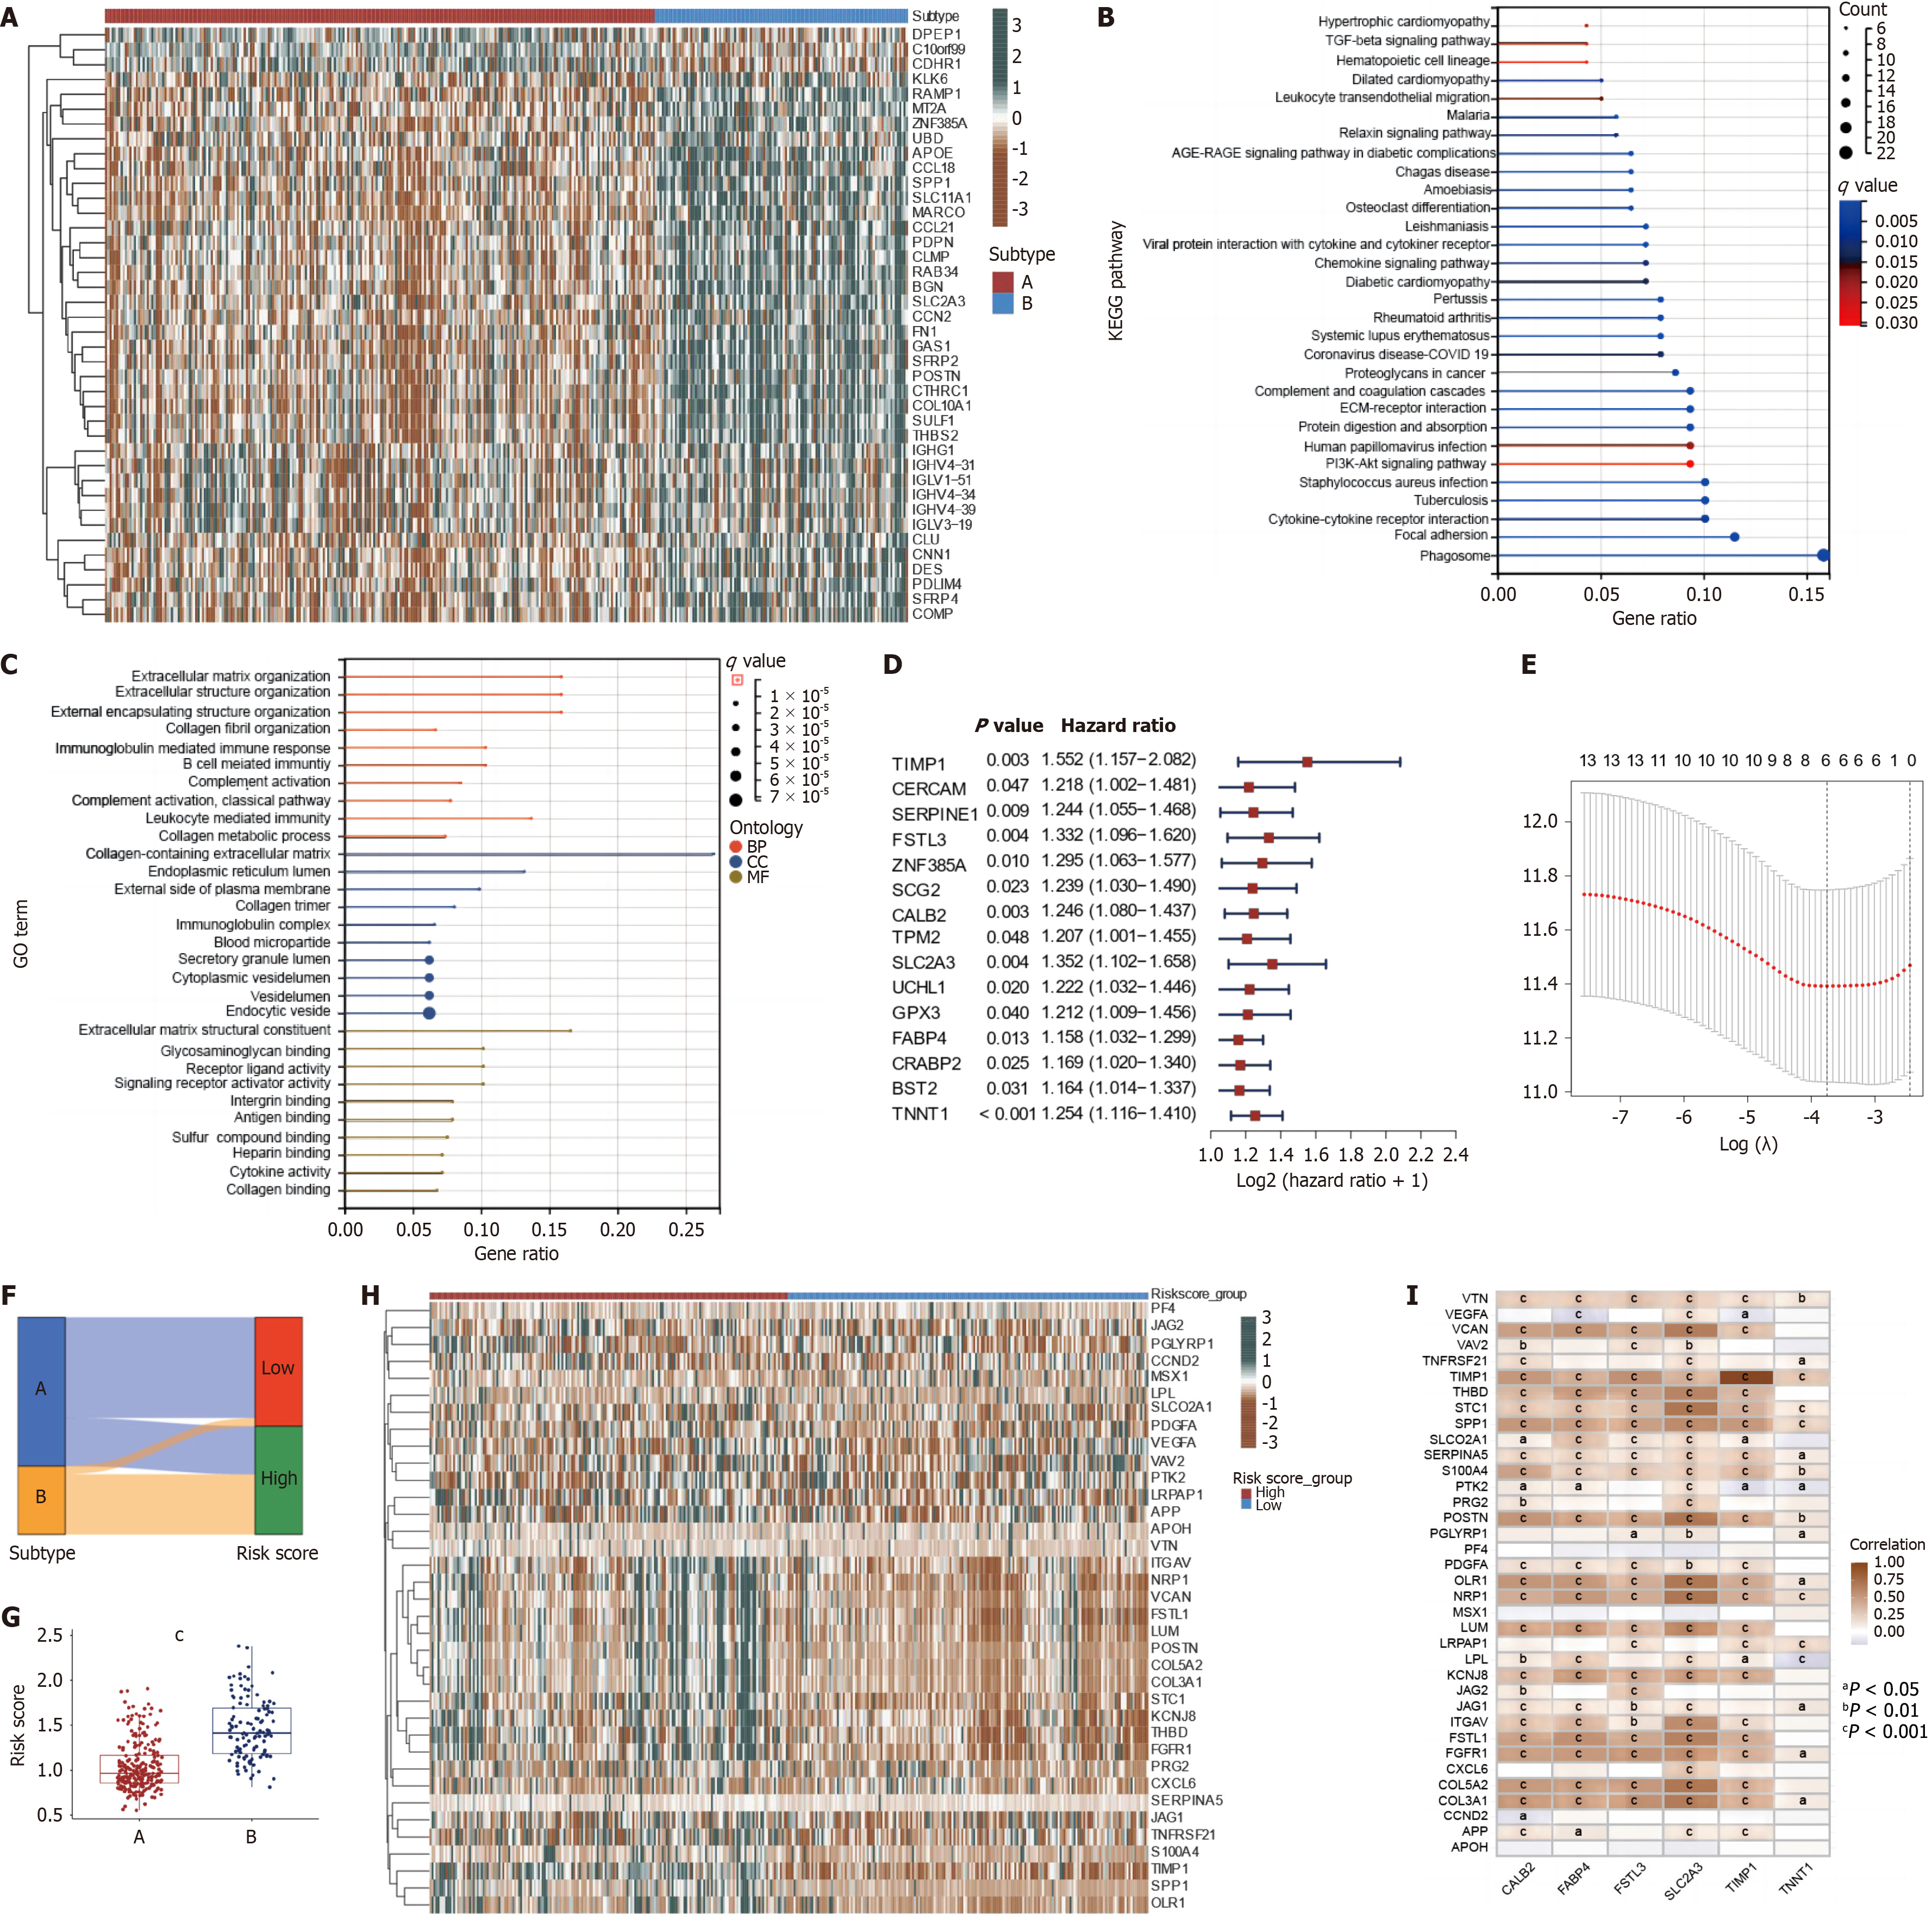
Figure 6 Identification of differentially expressed genes between angiogenesis subtypes and construction of the prognostic model.
A: Differentially expressed genes (DEGs) between two angiogenesis subtypes; B and C: Kyoto Encyclopedia of Genes and Genomes and Gene Ontology enrichment analyses of DEGs between two angiogenesis subtypes; D: Univariate Cox regression analysis of each DEG between two angiogenesis subtypes and 13 genes with P < 0.05; E: Cross-validation for tuning the parameter selection in the Least absolute shrinkage and selection operator regression; F: Sankey diagram of subtype distributions in angiogenesis subtypes and angiogenesis-related score (ARS) groups; G: Differences in ARS among two angiogenesis subtypes in colon cancer patients (P < 0.001); H: Heatmap (green: low expression level; brown: high expression level) of the angiogenesis-related genes between the low and high ARS groups; I: Correlations between the expression of 36 Angiogenesis related-genes and selected 6 genes in the ARS model. aP < 0.05; bP < 0.01; cP < 0.001.
- Citation: Yang Y, Qiu YT, Li WK, Cui ZL, Teng S, Wang YD, Wu J. Multi-Omics analysis elucidates tumor microenvironment and intratumor microbes of angiogenesis subtypes in colon cancer. World J Gastrointest Oncol 2024; 16(7): 3169-3192
- URL: https://www.wjgnet.com/1948-5204/full/v16/i7/3169.htm
- DOI: https://dx.doi.org/10.4251/wjgo.v16.i7.3169


