Copyright
©The Author(s) 2024.
World J Gastrointest Oncol. Jul 15, 2024; 16(7): 3169-3192
Published online Jul 15, 2024. doi: 10.4251/wjgo.v16.i7.3169
Published online Jul 15, 2024. doi: 10.4251/wjgo.v16.i7.3169
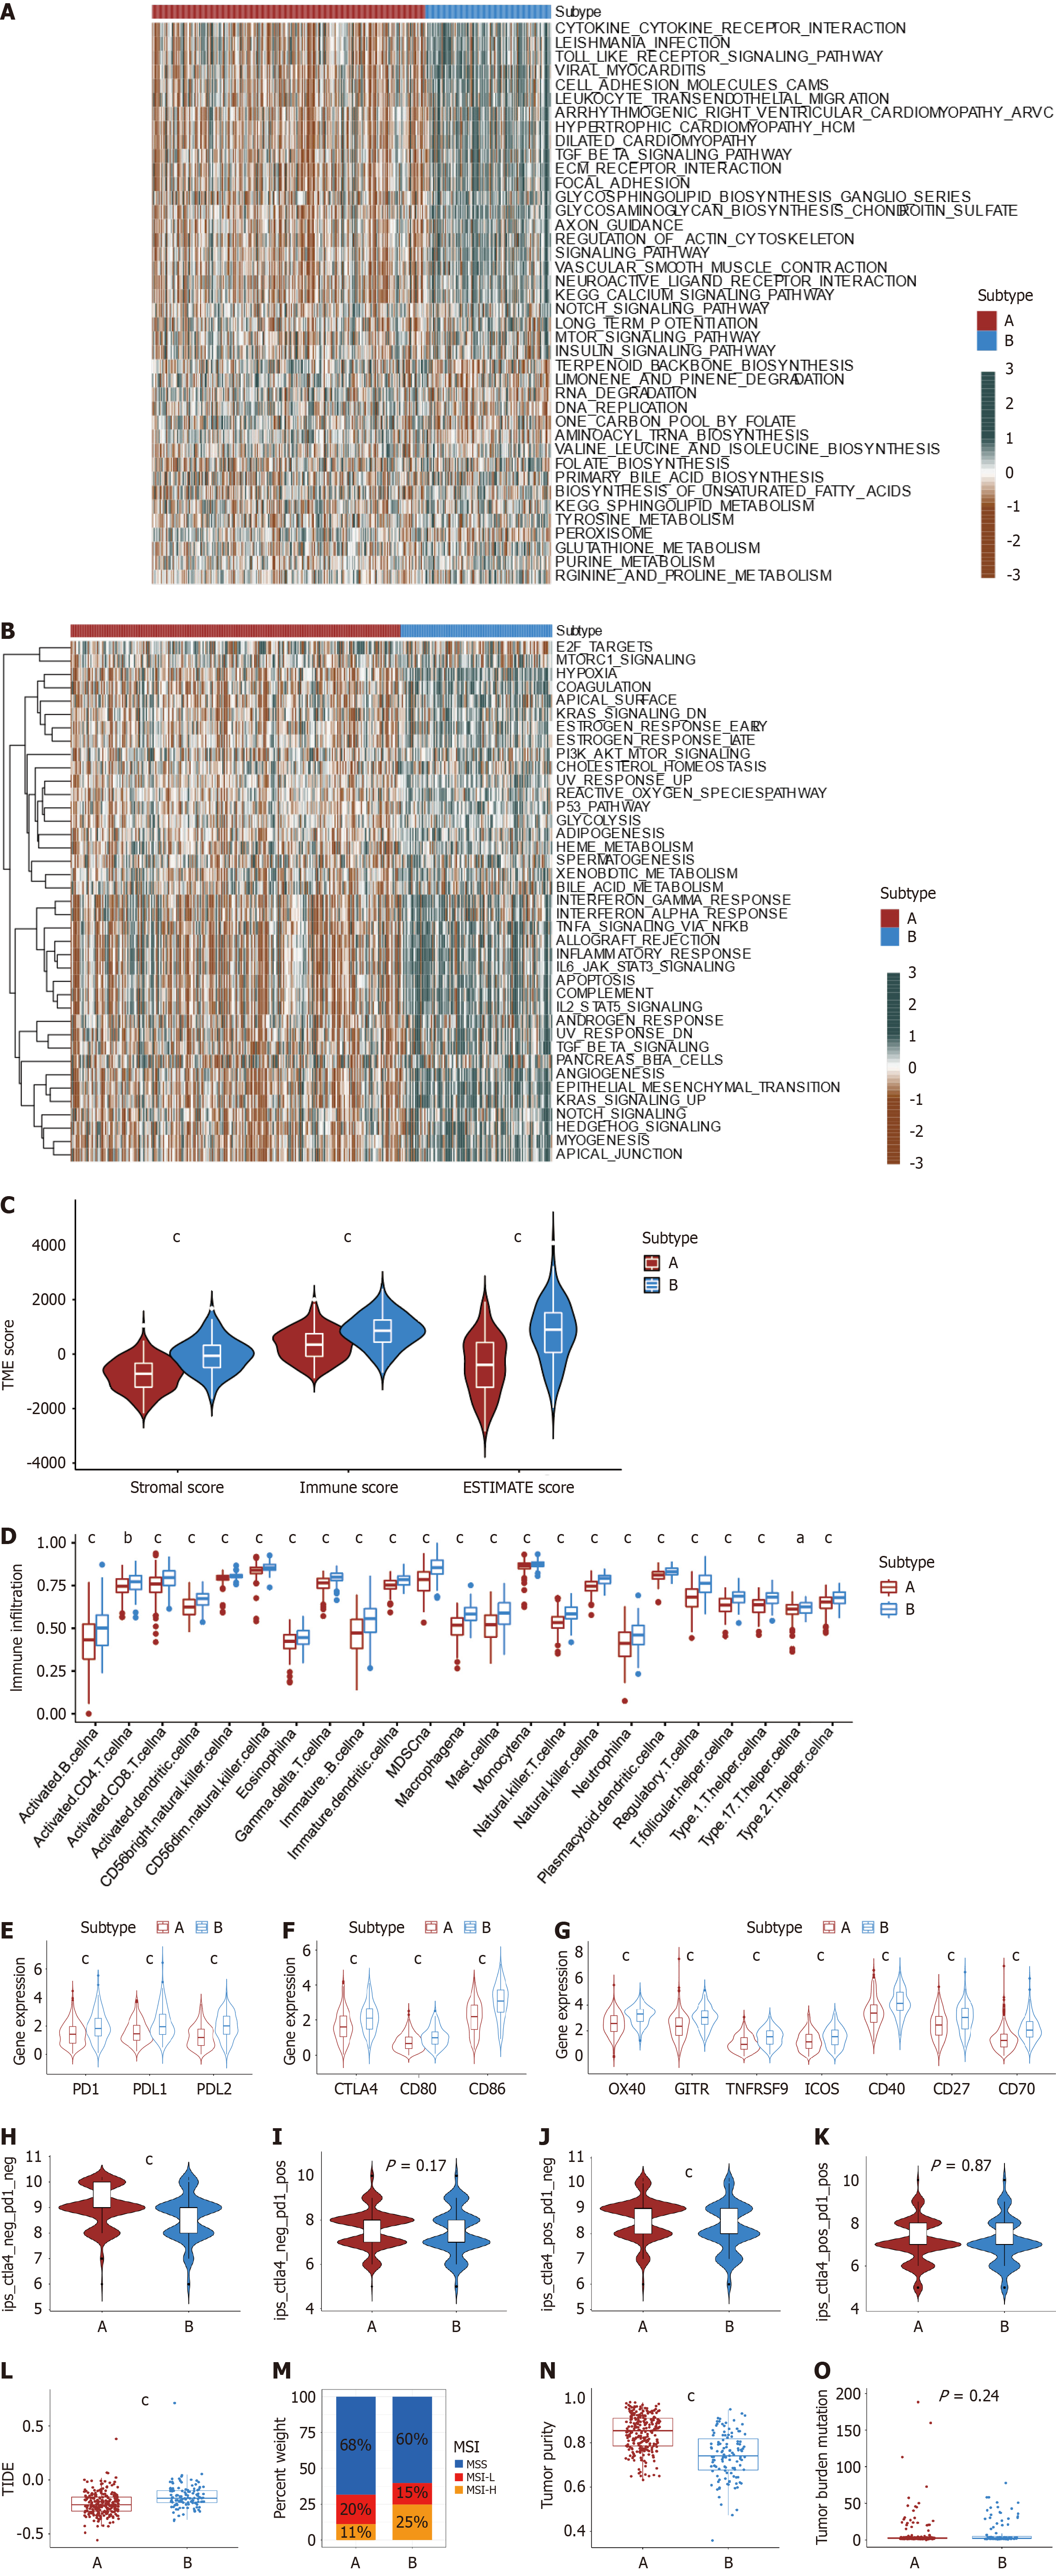
Figure 4 Identification of characterization in angiogenesis subtypes.
A and B: The differences in Kyoto Encyclopedia of Genes and Genomes and HALLMARKER pathway single-sample gene set enrichment analysis scores between the two angiogenesis subgroups; C: Correlations between the two angiogenesis subgroups and tumor microenvironment score; D: The abundance of immune cells in two angiogenesis subtypes; E: Differential expression of PD-1, PD-L1, and PD-L2 between two angiogenesis subtypes (P < 0.001); F: Differential CTLA4, CD80, and CD86 expression between two angiogenesis subtypes (P < 0.001); G: Differential expression of OX40, GITR, TNFRSF9, ICOS, CD40, CD27 and CD70 between two angiogenesis subtypes (P < 0.001); H-K: Immunopheno score in two angiogenesis subtypes; L: Tumor Immune Dysfunction and Exclusion scores in two angiogenesis subtypes; M: The proportion of angiogenesis subtypes in the three modification patterns [microsatellite stability (MSI), blue; MSI-low red; MSI-high orange]; N: Differences in tumor purity between two angiogenesis subtypes in colon cancer (CC) patients (P < 0.001); O: Differences in tumor mutational burden between two angiogenesis subtypes in CC patients (P < 0.001). aP < 0.05; bP < 0.01; cP < 0.001.
- Citation: Yang Y, Qiu YT, Li WK, Cui ZL, Teng S, Wang YD, Wu J. Multi-Omics analysis elucidates tumor microenvironment and intratumor microbes of angiogenesis subtypes in colon cancer. World J Gastrointest Oncol 2024; 16(7): 3169-3192
- URL: https://www.wjgnet.com/1948-5204/full/v16/i7/3169.htm
- DOI: https://dx.doi.org/10.4251/wjgo.v16.i7.3169


