Copyright
©The Author(s) 2024.
World J Gastrointest Oncol. Jul 15, 2024; 16(7): 3169-3192
Published online Jul 15, 2024. doi: 10.4251/wjgo.v16.i7.3169
Published online Jul 15, 2024. doi: 10.4251/wjgo.v16.i7.3169
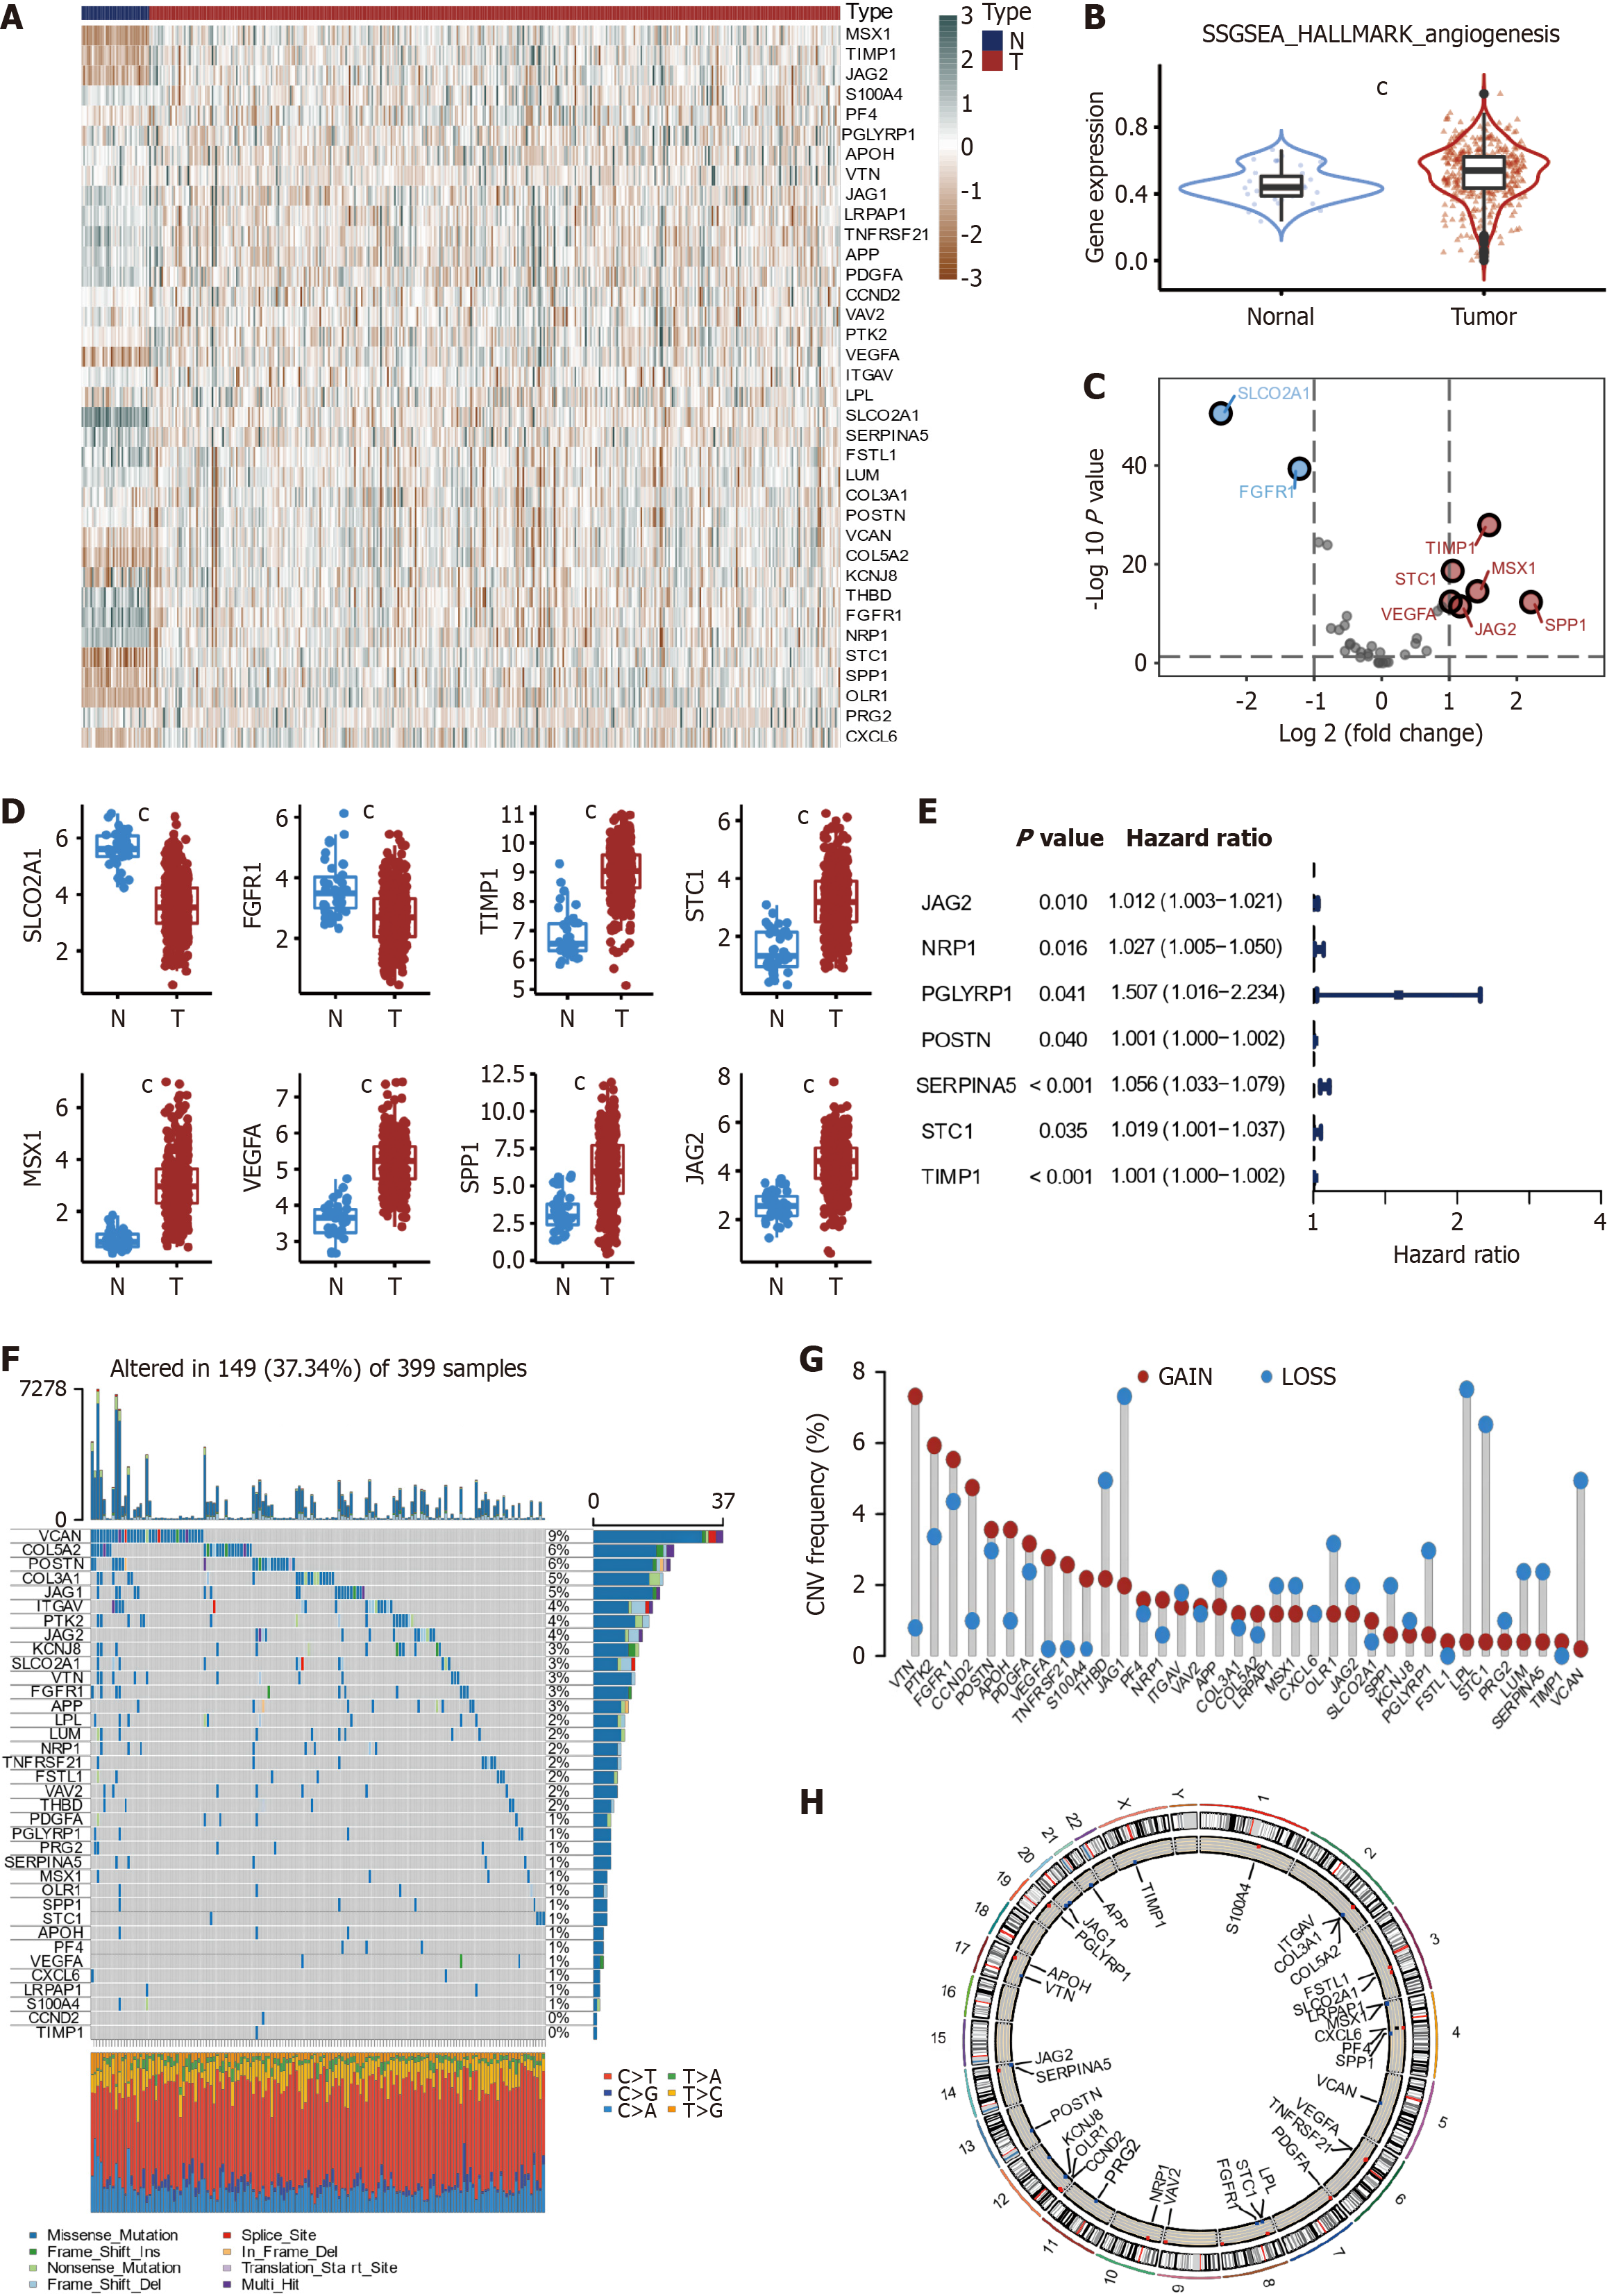
Figure 2 Expression landscape of angiogenesis-related genes in colon cancer.
A: Heatmap (green: low expression level; brown: high expression level) of the angiogenesis-related genes (ARGs) between the nontumor (blue) and tumor samples (red); B: Differences in angiogenesis pathway single-sample gene set enrichment analysis score between normal and colon cancer (CC) tissues; C: Volcano plot of the differential ARGs; D: The expression of 8 differentially expressed angiogenesis-related genes between normal and CC tissues; E: Univariate Cox regression analysis of 36 angiogenesis-related genes and seven genes with P < 0.05; F: Mutation frequencies and types of ARGs; G: The location of copy number variation (CNV) alteration of 36 ARGs on 23 chromosomes; H: Chromosomal localization of ARGs with CNV. ARGs: Angiogenesis-related genes. cP < 0.001.
- Citation: Yang Y, Qiu YT, Li WK, Cui ZL, Teng S, Wang YD, Wu J. Multi-Omics analysis elucidates tumor microenvironment and intratumor microbes of angiogenesis subtypes in colon cancer. World J Gastrointest Oncol 2024; 16(7): 3169-3192
- URL: https://www.wjgnet.com/1948-5204/full/v16/i7/3169.htm
- DOI: https://dx.doi.org/10.4251/wjgo.v16.i7.3169


