Copyright
©The Author(s) 2024.
World J Gastrointest Oncol. Jul 15, 2024; 16(7): 3082-3096
Published online Jul 15, 2024. doi: 10.4251/wjgo.v16.i7.3082
Published online Jul 15, 2024. doi: 10.4251/wjgo.v16.i7.3082
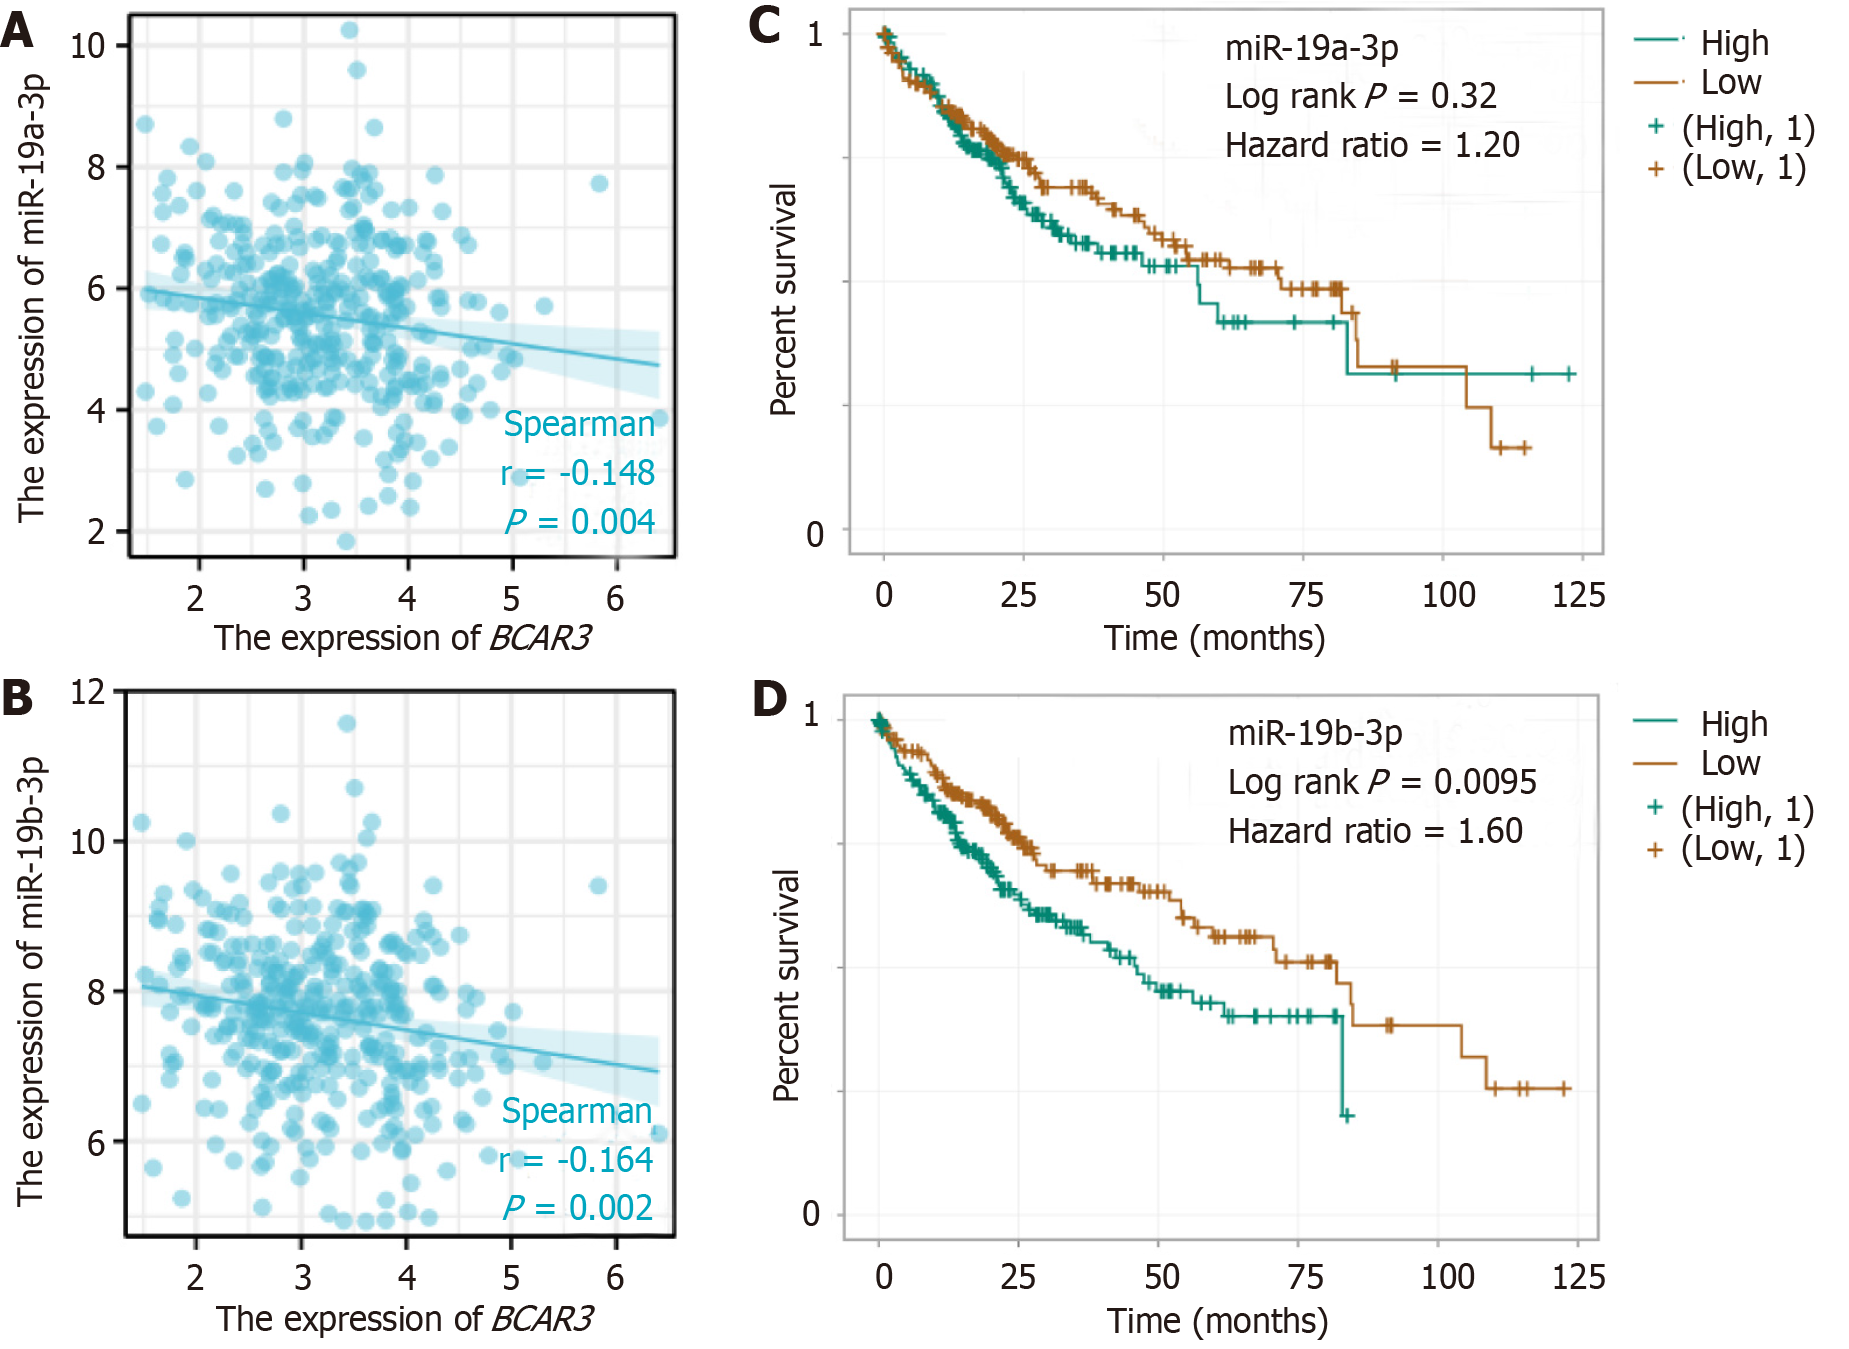
Figure 8 Correlation, and survival curve analyses between BCAR3 and 2 miRNAs.
A: Negative regulatory relationship between BCAR3 and miR-19a-3p, analyzed by Spearman correlate analysis; B: Negative regulatory relationship between BCAR3 and miR-19b-3p, analyzed by Spearman correlate analysis; C and D: Kaplan-Meier survival analysis of miR-19a-3p and miR-19b-3p expression in hepatocellular carcinoma (HCC) patients. Comparison between high expression group and low expression group was performed by Log rank. Hazard ratio (HR) represents the risk factor of the high expression group relative to the low expression group sample. HR > 1 indicates that the miRNA is a risk factor for HCC.
- Citation: Shi HQ, Huang S, Ma XY, Tan ZJ, Luo R, Luo B, Zhang W, Shi L, Zhong XL, Lü MH, Chen X, Tang XW. BCAR3 and BCAR3-related competing endogenous RNA expression in hepatocellular carcinoma and their prognostic value. World J Gastrointest Oncol 2024; 16(7): 3082-3096
- URL: https://www.wjgnet.com/1948-5204/full/v16/i7/3082.htm
- DOI: https://dx.doi.org/10.4251/wjgo.v16.i7.3082


