Copyright
©The Author(s) 2024.
World J Gastrointest Oncol. Jul 15, 2024; 16(7): 3082-3096
Published online Jul 15, 2024. doi: 10.4251/wjgo.v16.i7.3082
Published online Jul 15, 2024. doi: 10.4251/wjgo.v16.i7.3082
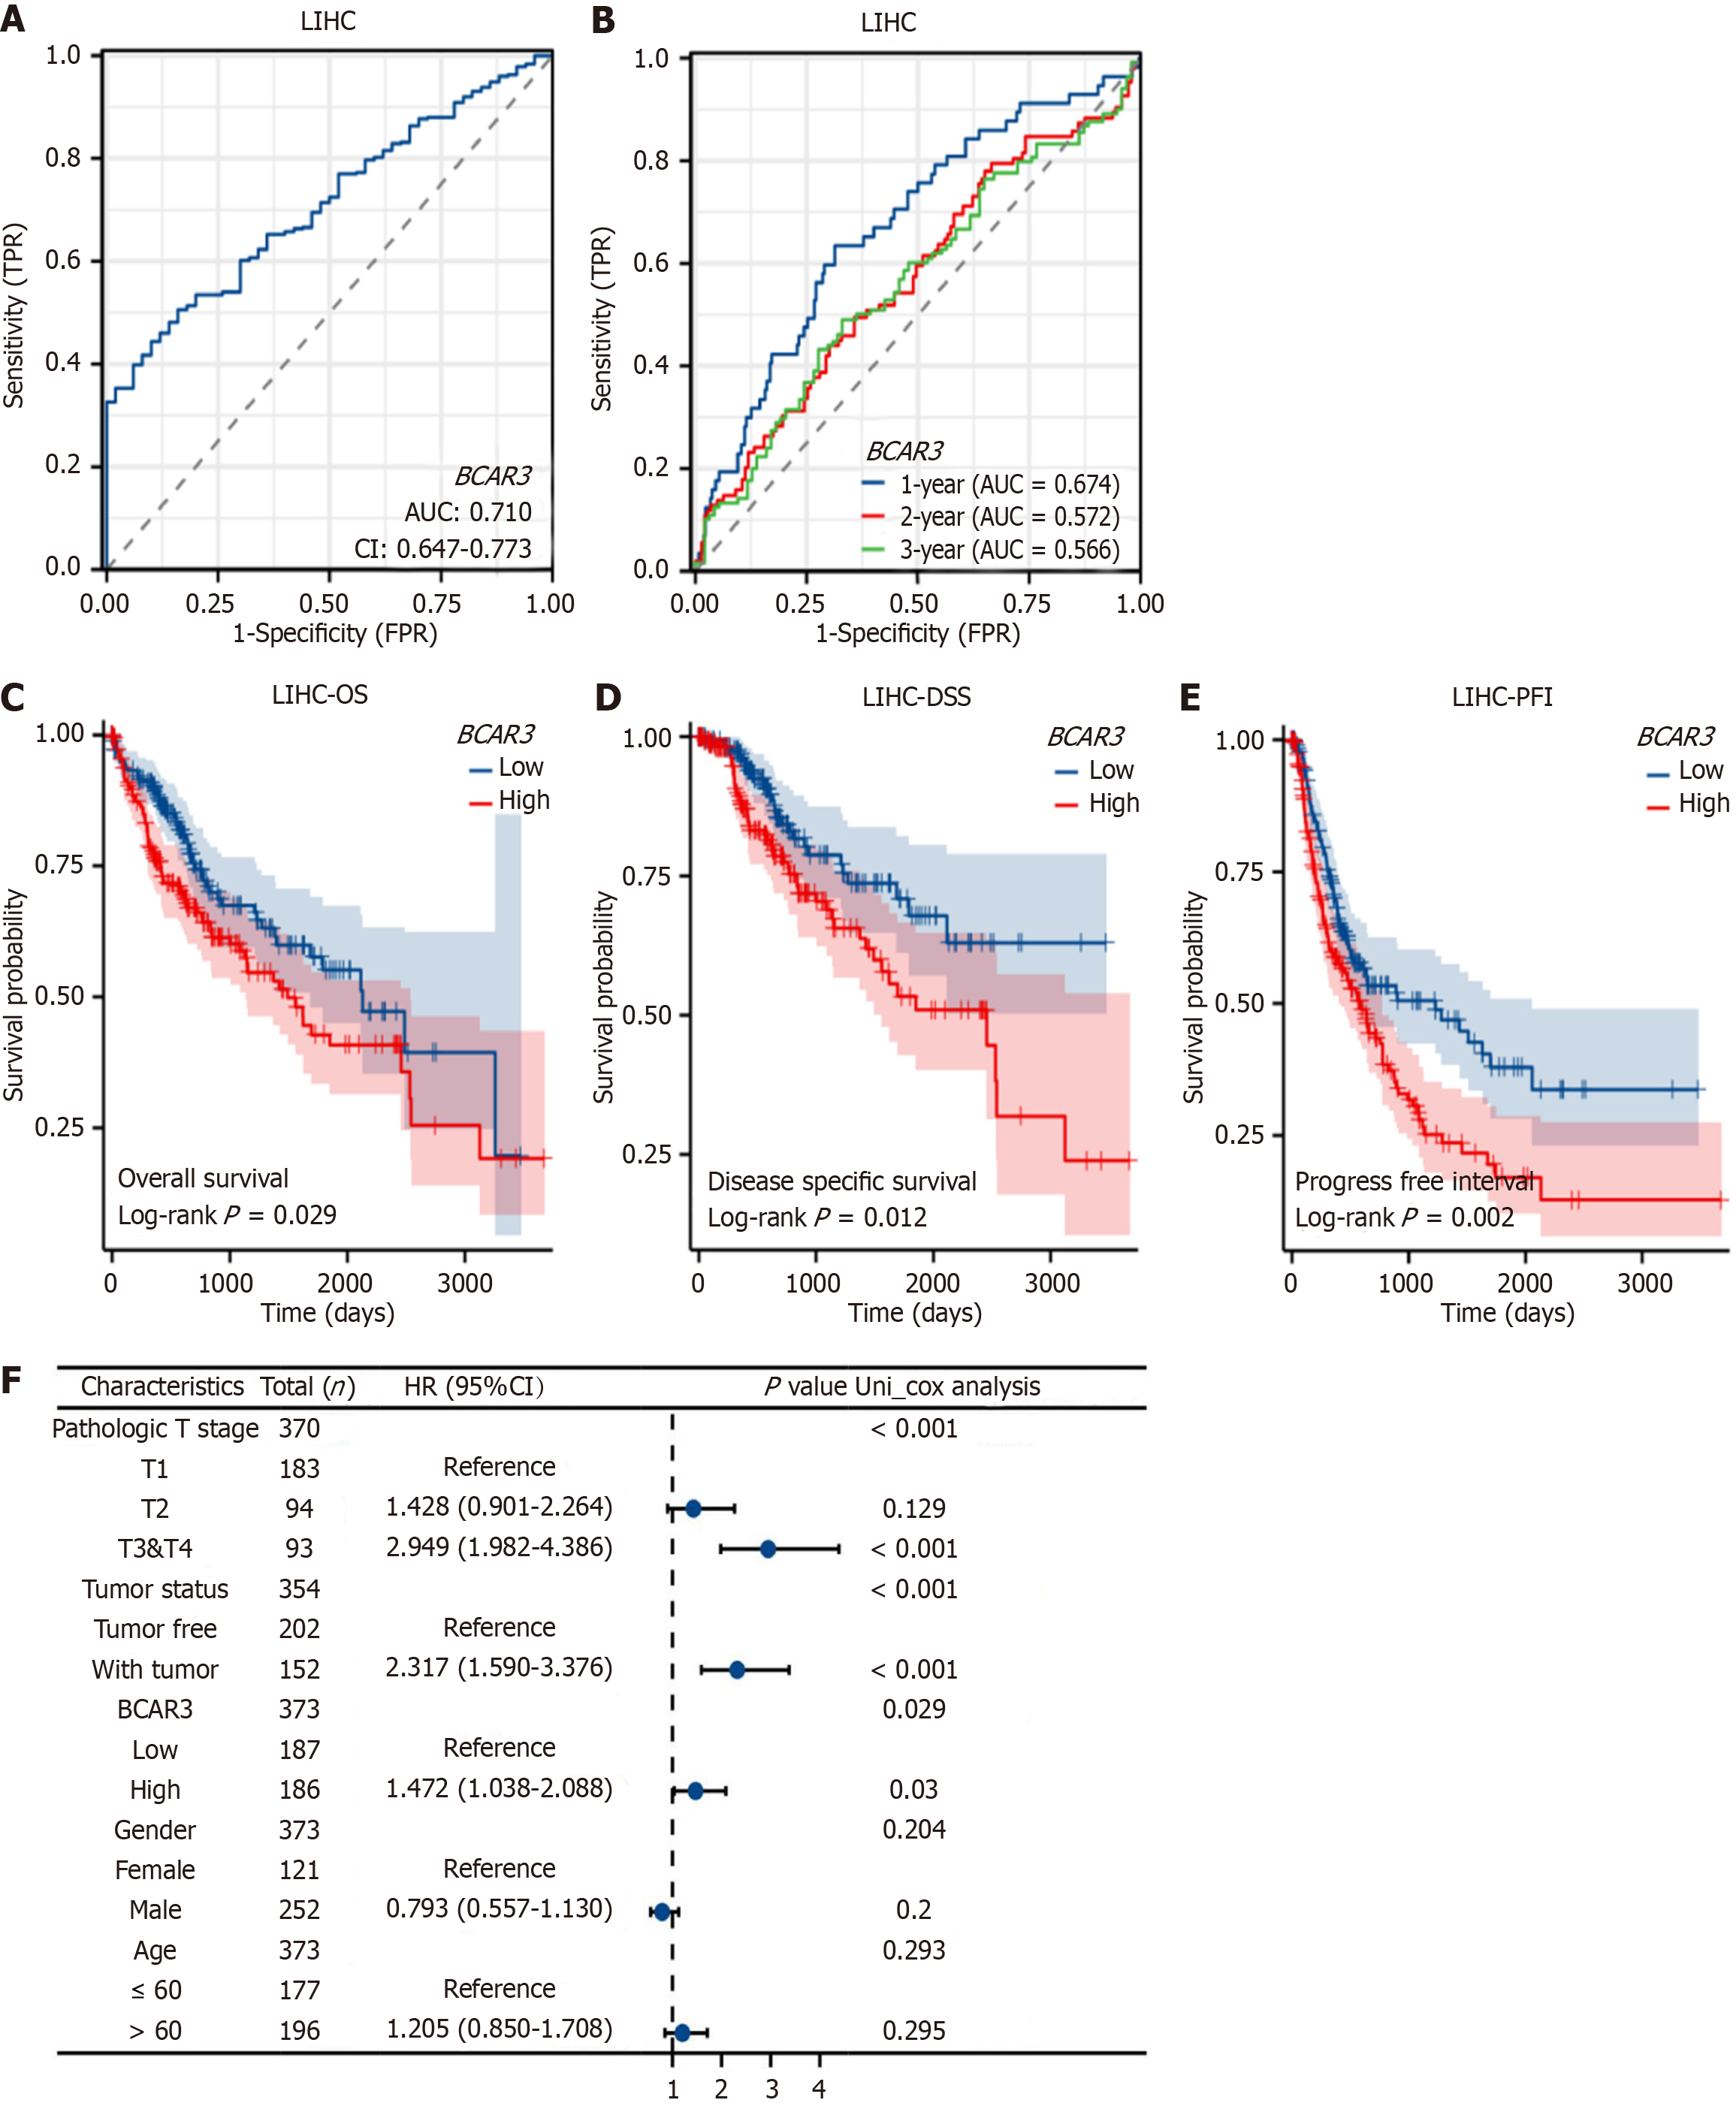
Figure 3 Effect of BCAR3 on diagnosis and prognosis of hepatocellular carcinoma.
A: Receiver operating characteristic (ROC) curve and area under curve (AUC) value of BCAR3 gene expression in diagnosing hepatocellular carcinoma (HCC). The blue curve represents the ROC curve and AUC = 0.71; B: ROC curve and AUC value of BCAR3 gene expression in predicting the 1, 2 and 3 year survival time of HCC patients. Larger AUC values corresponding to better prediction performance; C-E: Effects of BCAR3 expression on overall survival (OS), disease specific survival and progression free interval of HCC. Comparison between high expression group and low expression group was performed by Log rank; F: Forest plot for univariate cox regression analysis of BCAR3 expression with OS in HCC with different clinicopathologic features. High expression of BCAR3 is a risk factor for HCC. AUC: Area under curve.
- Citation: Shi HQ, Huang S, Ma XY, Tan ZJ, Luo R, Luo B, Zhang W, Shi L, Zhong XL, Lü MH, Chen X, Tang XW. BCAR3 and BCAR3-related competing endogenous RNA expression in hepatocellular carcinoma and their prognostic value. World J Gastrointest Oncol 2024; 16(7): 3082-3096
- URL: https://www.wjgnet.com/1948-5204/full/v16/i7/3082.htm
- DOI: https://dx.doi.org/10.4251/wjgo.v16.i7.3082


