Copyright
©The Author(s) 2024.
World J Gastrointest Oncol. Jul 15, 2024; 16(7): 3032-3054
Published online Jul 15, 2024. doi: 10.4251/wjgo.v16.i7.3032
Published online Jul 15, 2024. doi: 10.4251/wjgo.v16.i7.3032
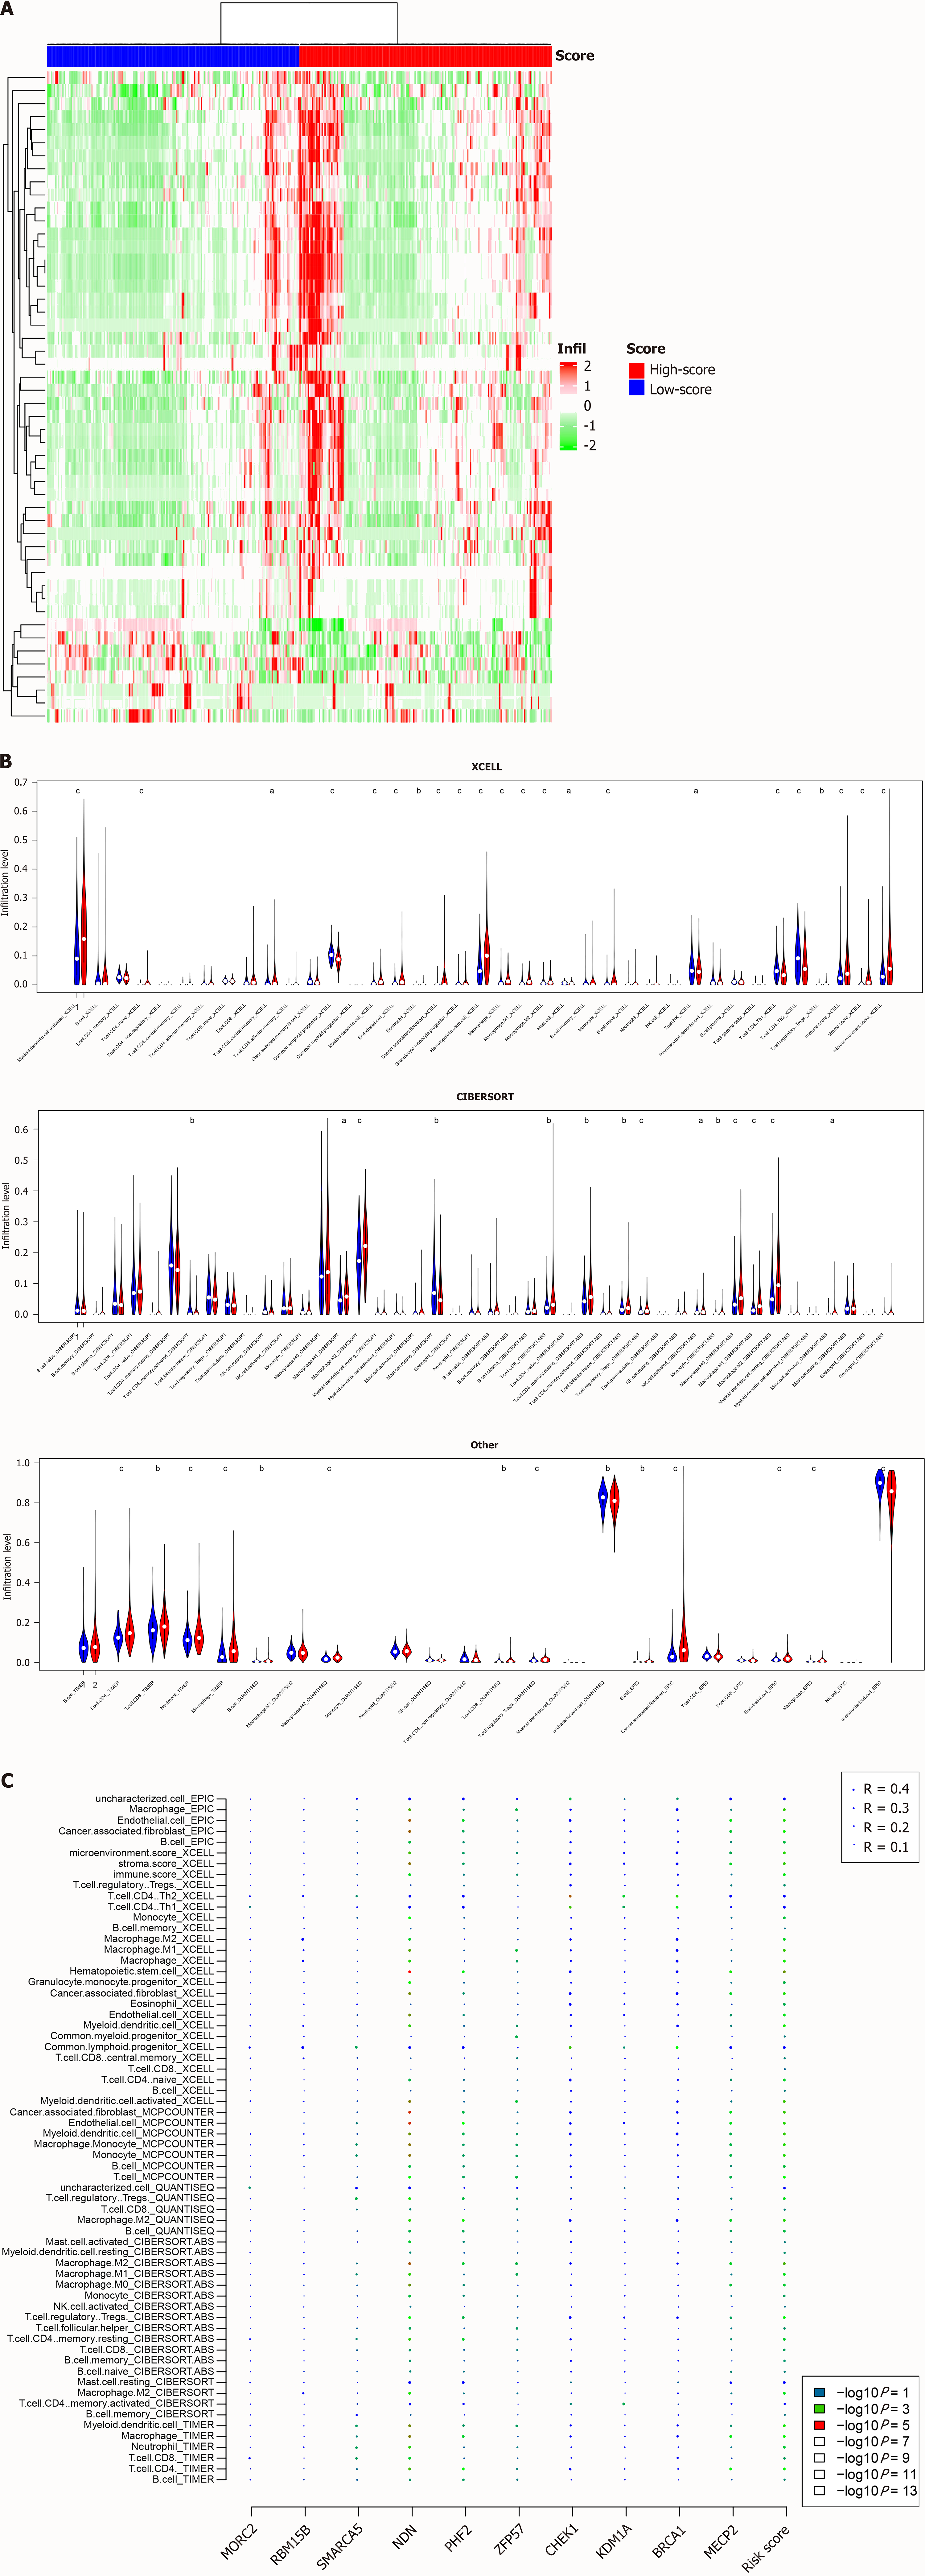
Figure 6 Immune abundance and the signature.
A: Differentially infiltrated cell types in TCGA dataset were identified; B: A high proportion of cell types according to different algorithms were significantly infiltrated between high and low-risk groups; C: correlation analyses revealed that the correlation was contributed by several genes. aP < 0.05, bP < 0.01, cP < 0.001.
- Citation: Liu HX, Feng J, Jiang JJ, Shen WJ, Zheng Y, Liu G, Gao XY. Integrated single-cell and bulk RNA sequencing revealed an epigenetic signature predicts prognosis and tumor microenvironment colorectal cancer heterogeneity. World J Gastrointest Oncol 2024; 16(7): 3032-3054
- URL: https://www.wjgnet.com/1948-5204/full/v16/i7/3032.htm
- DOI: https://dx.doi.org/10.4251/wjgo.v16.i7.3032


