Copyright
©The Author(s) 2024.
World J Gastrointest Oncol. Jul 15, 2024; 16(7): 3032-3054
Published online Jul 15, 2024. doi: 10.4251/wjgo.v16.i7.3032
Published online Jul 15, 2024. doi: 10.4251/wjgo.v16.i7.3032
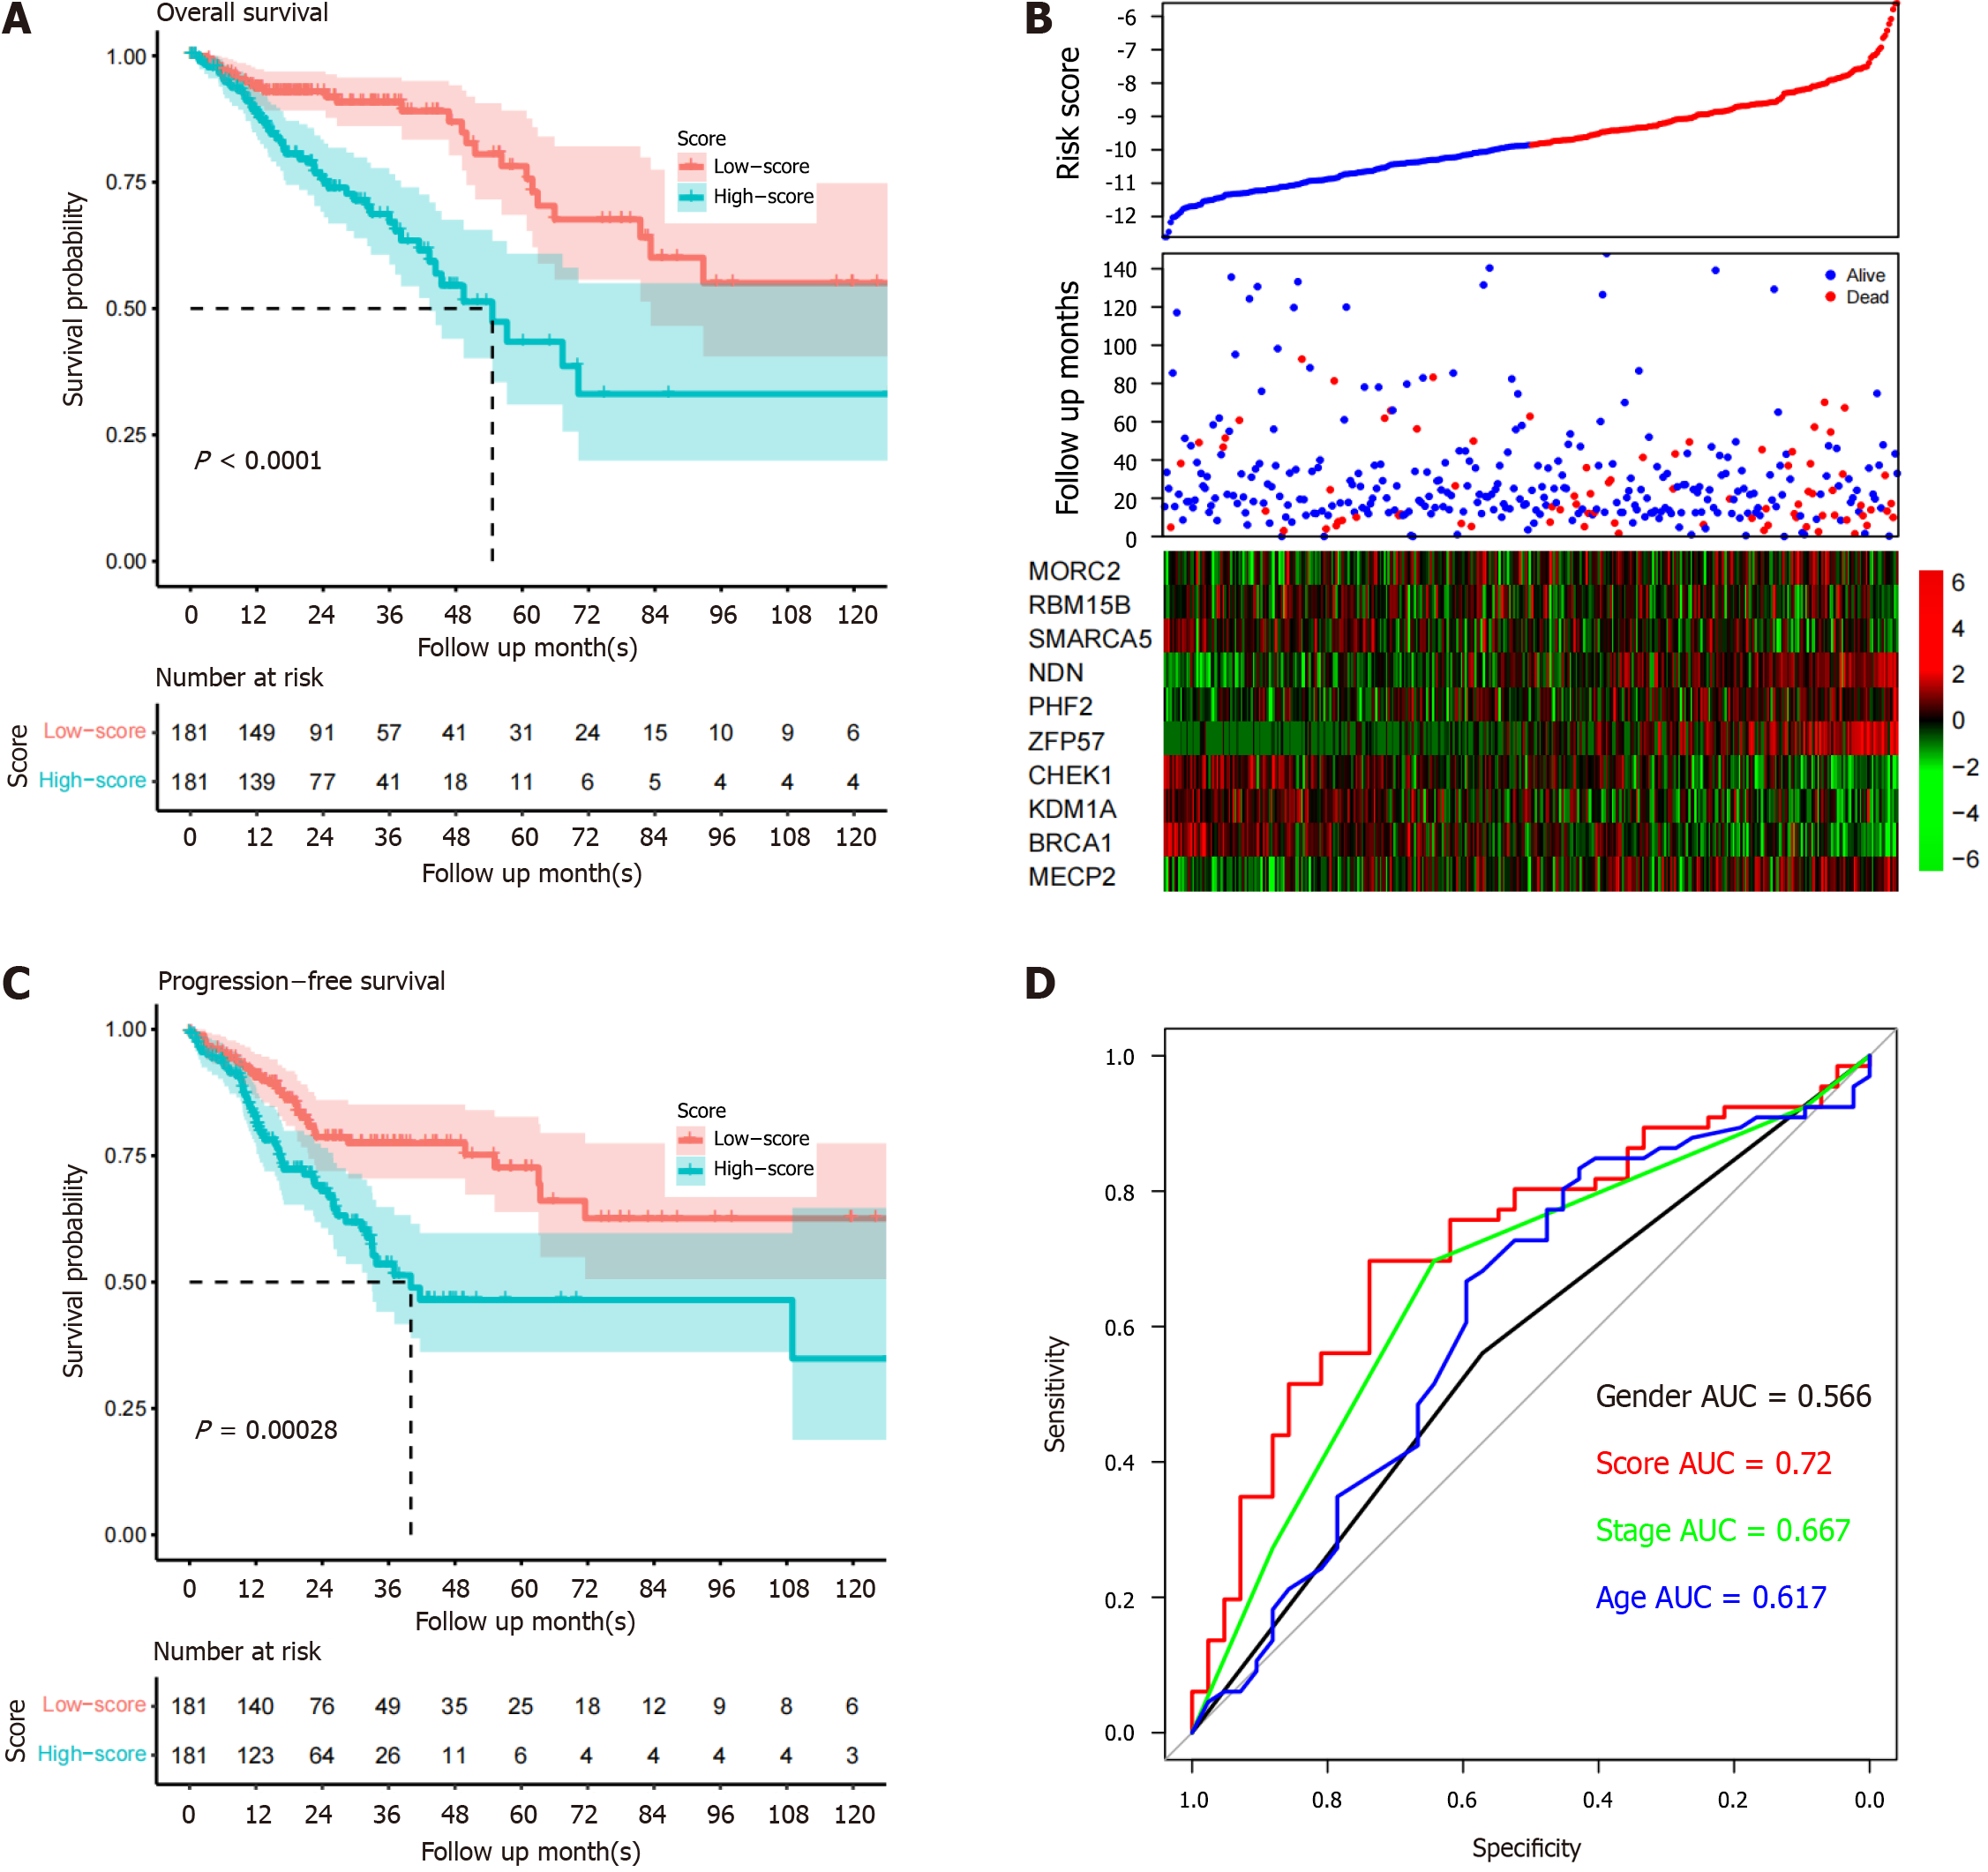
Figure 2 Signature performance in the TCGA dataset.
A: Overall survival period of high-risk samples is significantly shorter compared to low-risk samples; B: Heatmap of candidate genes suggests that high-risk samples have high expression of certain genes; C: Progression-free survival of group samples is similar to the overall survival pattern; D: Five-year survival receiver operating characteristic curve of the model and other clinical indicators. AUC: Area under the curve.
- Citation: Liu HX, Feng J, Jiang JJ, Shen WJ, Zheng Y, Liu G, Gao XY. Integrated single-cell and bulk RNA sequencing revealed an epigenetic signature predicts prognosis and tumor microenvironment colorectal cancer heterogeneity. World J Gastrointest Oncol 2024; 16(7): 3032-3054
- URL: https://www.wjgnet.com/1948-5204/full/v16/i7/3032.htm
- DOI: https://dx.doi.org/10.4251/wjgo.v16.i7.3032


