Copyright
©The Author(s) 2024.
World J Gastrointest Oncol. Jul 15, 2024; 16(7): 3011-3031
Published online Jul 15, 2024. doi: 10.4251/wjgo.v16.i7.3011
Published online Jul 15, 2024. doi: 10.4251/wjgo.v16.i7.3011
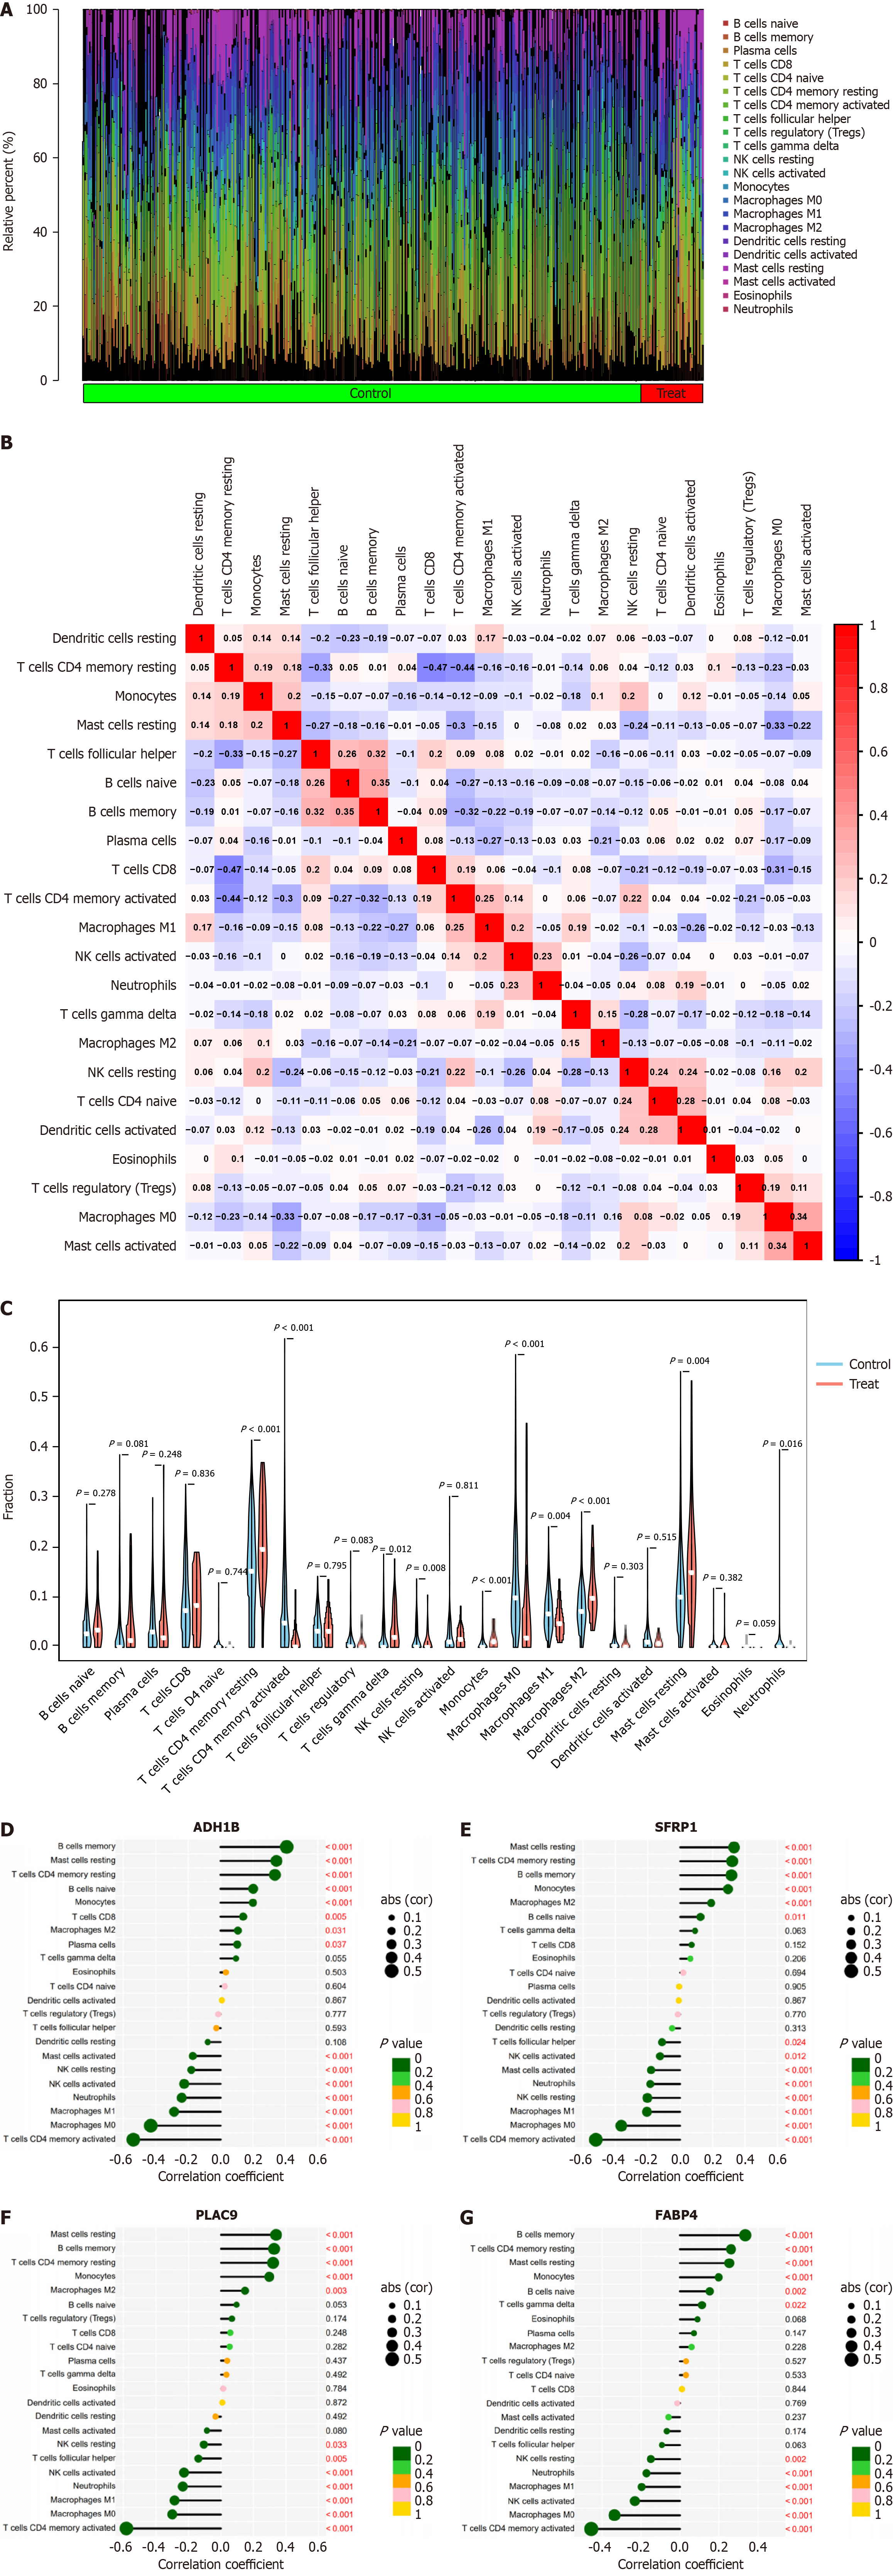
Figure 6 Assessment and visualization of immune cell infiltration between high and low expression of adipocytes in gastric cancer.
A: Proportion of infiltrating immune cells in samples with high and low expression of adipocytes in gastric cancer; B: Violin plots showed differential expression of 22 infiltrating immune cells between high and low expression of adipocytes in gastric cancer; C: Heatmap represented the 22 immune cell infiltrations between samples with high and low expression of adipocytes in gastric cancer. Blue and red colors indicate positive and negative correlations, respectively. The darker the color, the stronger the correlation; D: Lollipop plot showed the correlation between ADH1B expression levels and the infiltration of 22 immune cells; E: Lollipop plot illustrated the correlation between SFRP1 expression levels and the infiltration of 22 immune cells; F: Lollipop plot displayed the correlation between PLAC9 expression levels and the infiltration of 22 immune cells; G: Lollipop plot presented the correlation between FABP4 expression levels and the infiltration of 22 immune cells. NK: Natural killer.
- Citation: Shang JR, Zhu J, Bai L, Kulabiek D, Zhai XX, Zheng X, Qian J. Adipocytes impact on gastric cancer progression: Prognostic insights and molecular features. World J Gastrointest Oncol 2024; 16(7): 3011-3031
- URL: https://www.wjgnet.com/1948-5204/full/v16/i7/3011.htm
- DOI: https://dx.doi.org/10.4251/wjgo.v16.i7.3011


