Copyright
©The Author(s) 2024.
World J Gastrointest Oncol. Jul 15, 2024; 16(7): 3011-3031
Published online Jul 15, 2024. doi: 10.4251/wjgo.v16.i7.3011
Published online Jul 15, 2024. doi: 10.4251/wjgo.v16.i7.3011
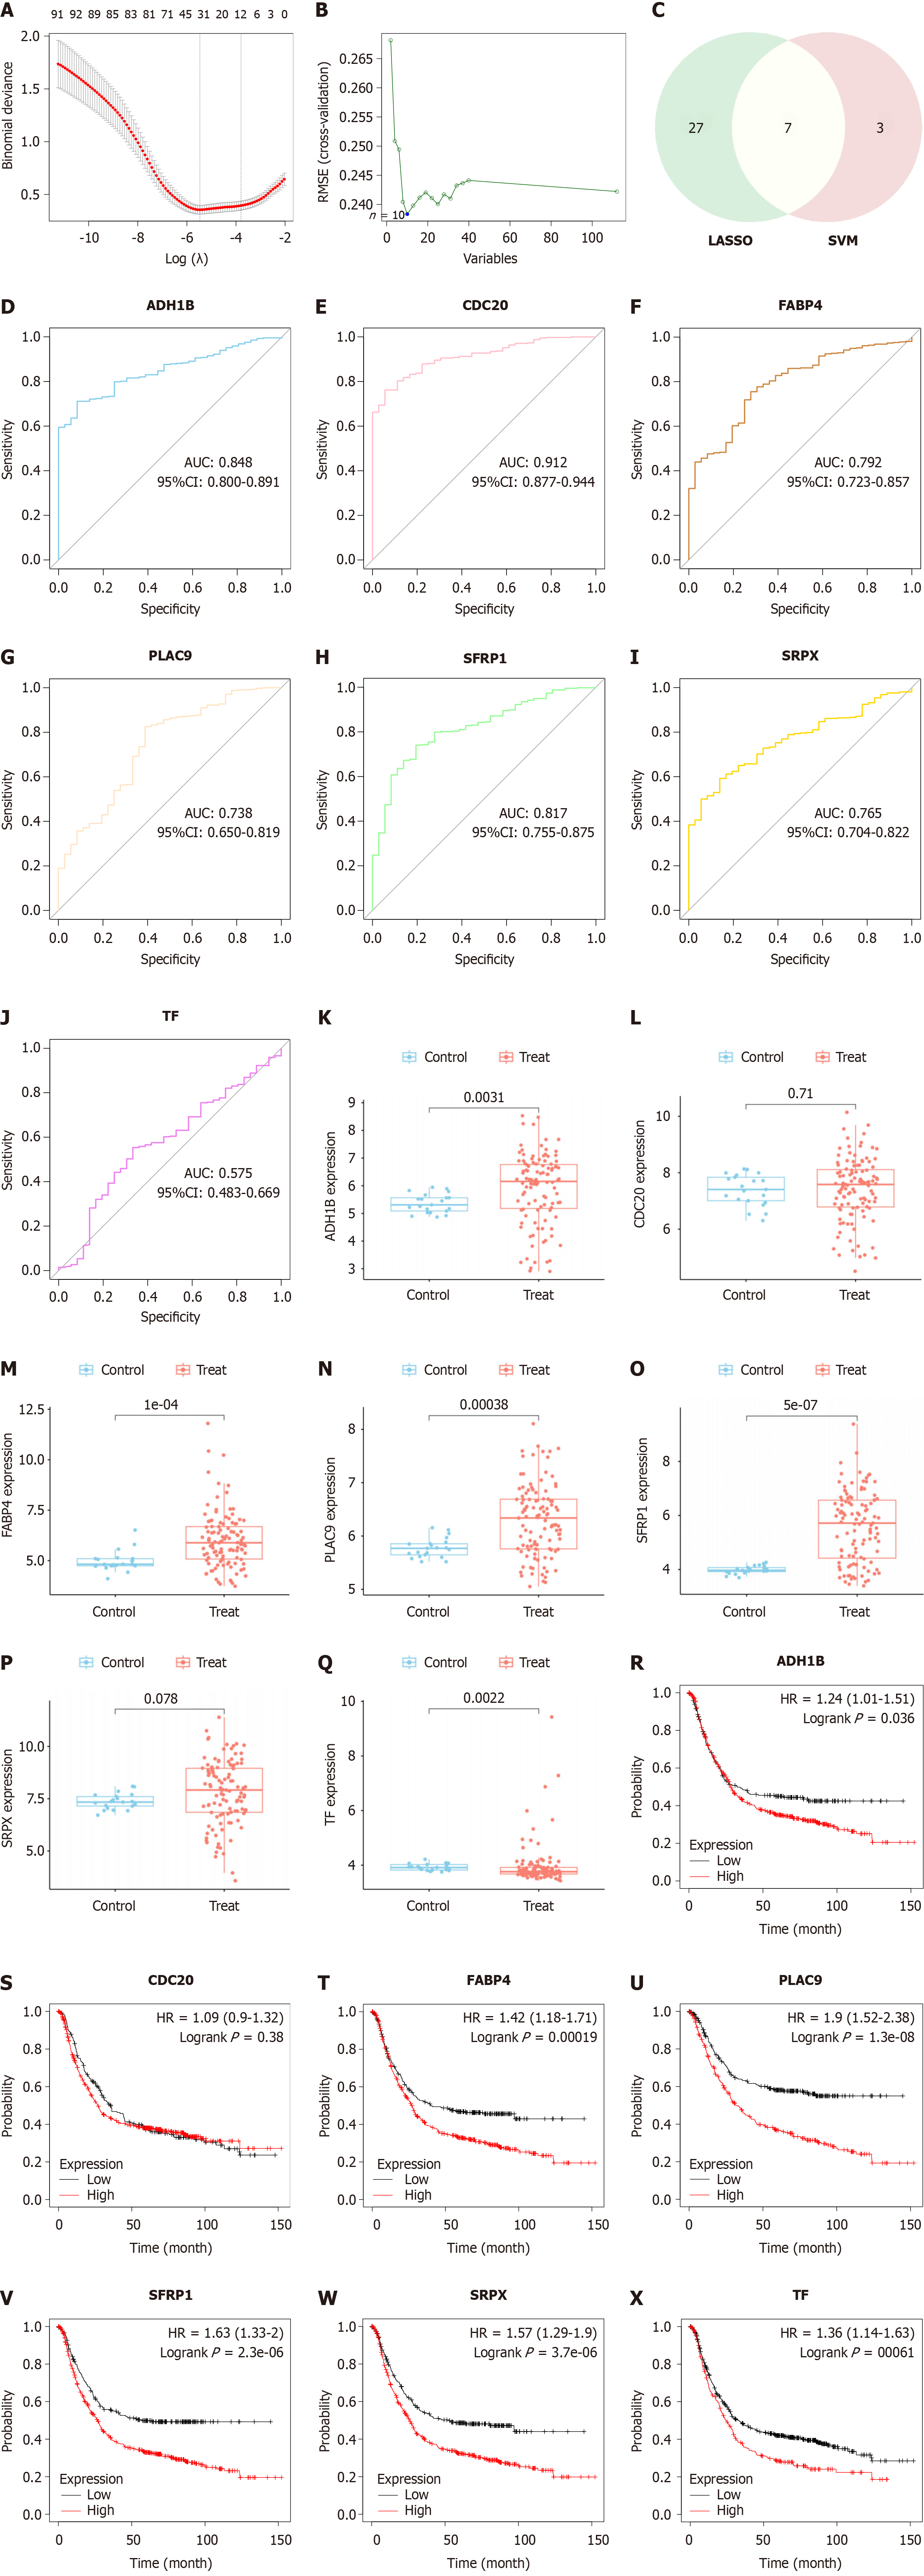
Figure 5 Selection of candidate diagnostic and prognostic biomarkers.
A: Logistic regression algorithm screened 34 diagnostic markers through the least absolute shrinkage and selection operator (LASSO); B: Support vector machine (SVM) recursive feature elimination algorithm identified 19 diagnostic markers; C: Venn diagram included seven genes; D-J: Expression levels of candidate diagnostic genes in GSE54129; K-Q: Expression levels of candidate diagnostic genes in TCGA; R-X: Kaplan-Meier survival analysis of candidate genes in gastric cancer. AUC: Area under the curve; CI: Confidence interval; HR: Hazard ratio.
- Citation: Shang JR, Zhu J, Bai L, Kulabiek D, Zhai XX, Zheng X, Qian J. Adipocytes impact on gastric cancer progression: Prognostic insights and molecular features. World J Gastrointest Oncol 2024; 16(7): 3011-3031
- URL: https://www.wjgnet.com/1948-5204/full/v16/i7/3011.htm
- DOI: https://dx.doi.org/10.4251/wjgo.v16.i7.3011


