Copyright
©The Author(s) 2024.
World J Gastrointest Oncol. Jul 15, 2024; 16(7): 3011-3031
Published online Jul 15, 2024. doi: 10.4251/wjgo.v16.i7.3011
Published online Jul 15, 2024. doi: 10.4251/wjgo.v16.i7.3011
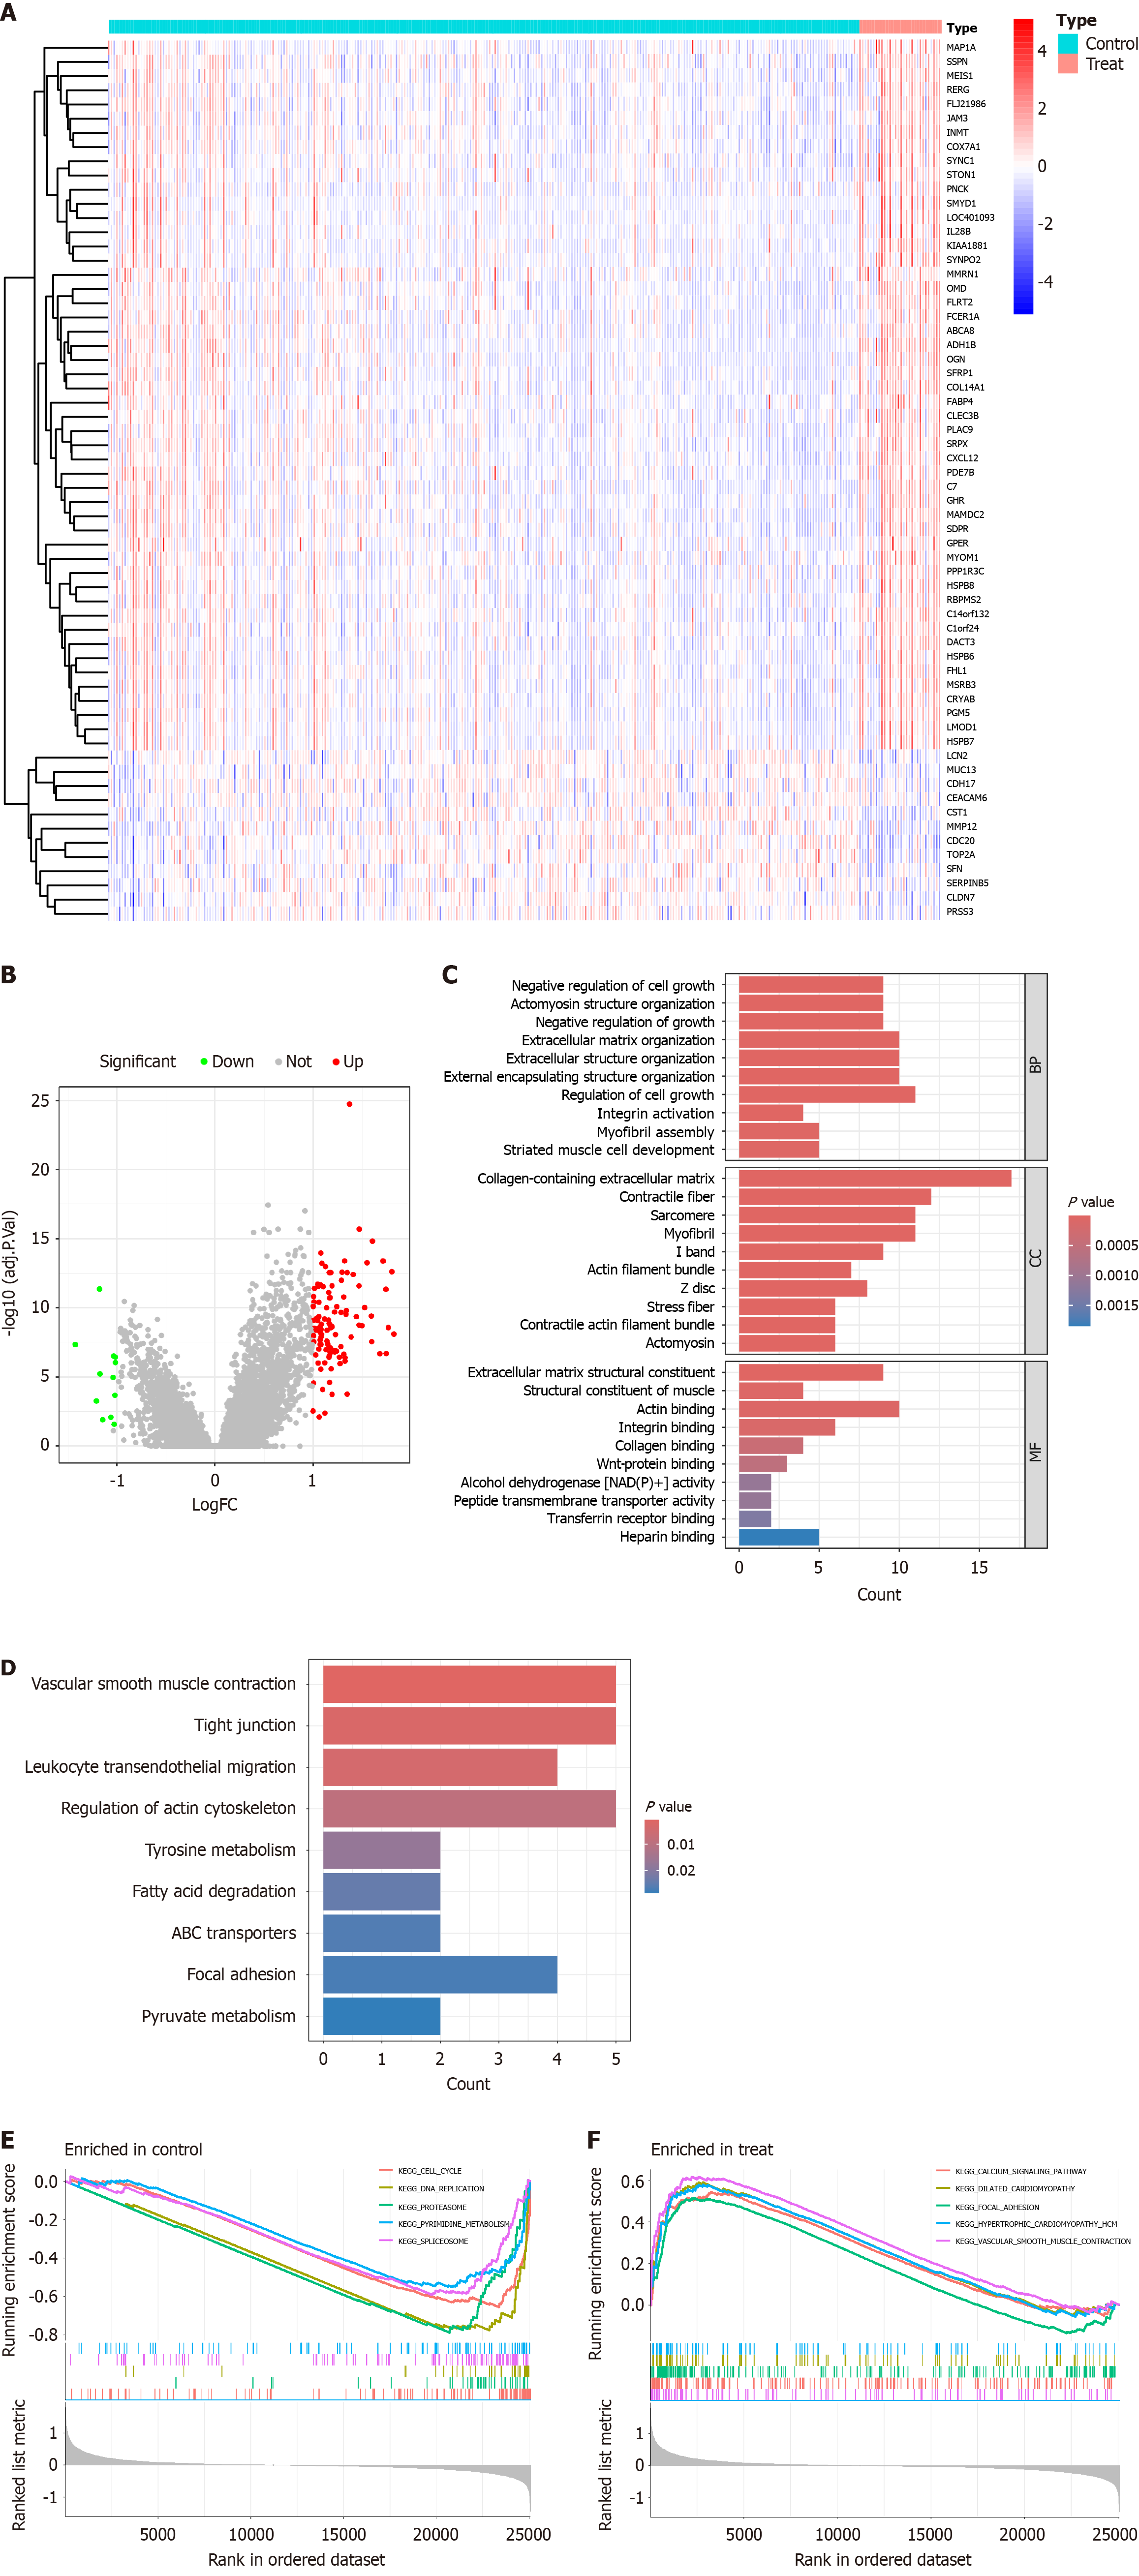
Figure 4 Analysis and functional enrichment of differentially expressed genes in the high and low expression groups of adipocytes.
A: Heatmap of differentially expressed genes (DEGs). Different colors represent the expression trends of genes in different tissues; B: Volcano plot of DEGs constructed using fold change values and P-adjust. Red dots represent upregulated DEGs, gray dots represent non-significant genes, and green dots represent downregulated DEGs; C: Bar plot of Gene Ontology enrichment analysis for DEGs; D: Bar plot of (KEGG) Encyclopedia of Genes and Genomes enrichment analysis for DEGs; E: Gene Set Enrichment Analysis enrichment analysis results for the high expression group of adipocytes; F: Gene Set Enrichment Analysis enrichment analysis results for the low expression group of adipocytes. BP: Biological process; CC: Cell compound; MF: Molecular function.
- Citation: Shang JR, Zhu J, Bai L, Kulabiek D, Zhai XX, Zheng X, Qian J. Adipocytes impact on gastric cancer progression: Prognostic insights and molecular features. World J Gastrointest Oncol 2024; 16(7): 3011-3031
- URL: https://www.wjgnet.com/1948-5204/full/v16/i7/3011.htm
- DOI: https://dx.doi.org/10.4251/wjgo.v16.i7.3011


