Copyright
©The Author(s) 2024.
World J Gastrointest Oncol. Jul 15, 2024; 16(7): 2971-2987
Published online Jul 15, 2024. doi: 10.4251/wjgo.v16.i7.2971
Published online Jul 15, 2024. doi: 10.4251/wjgo.v16.i7.2971
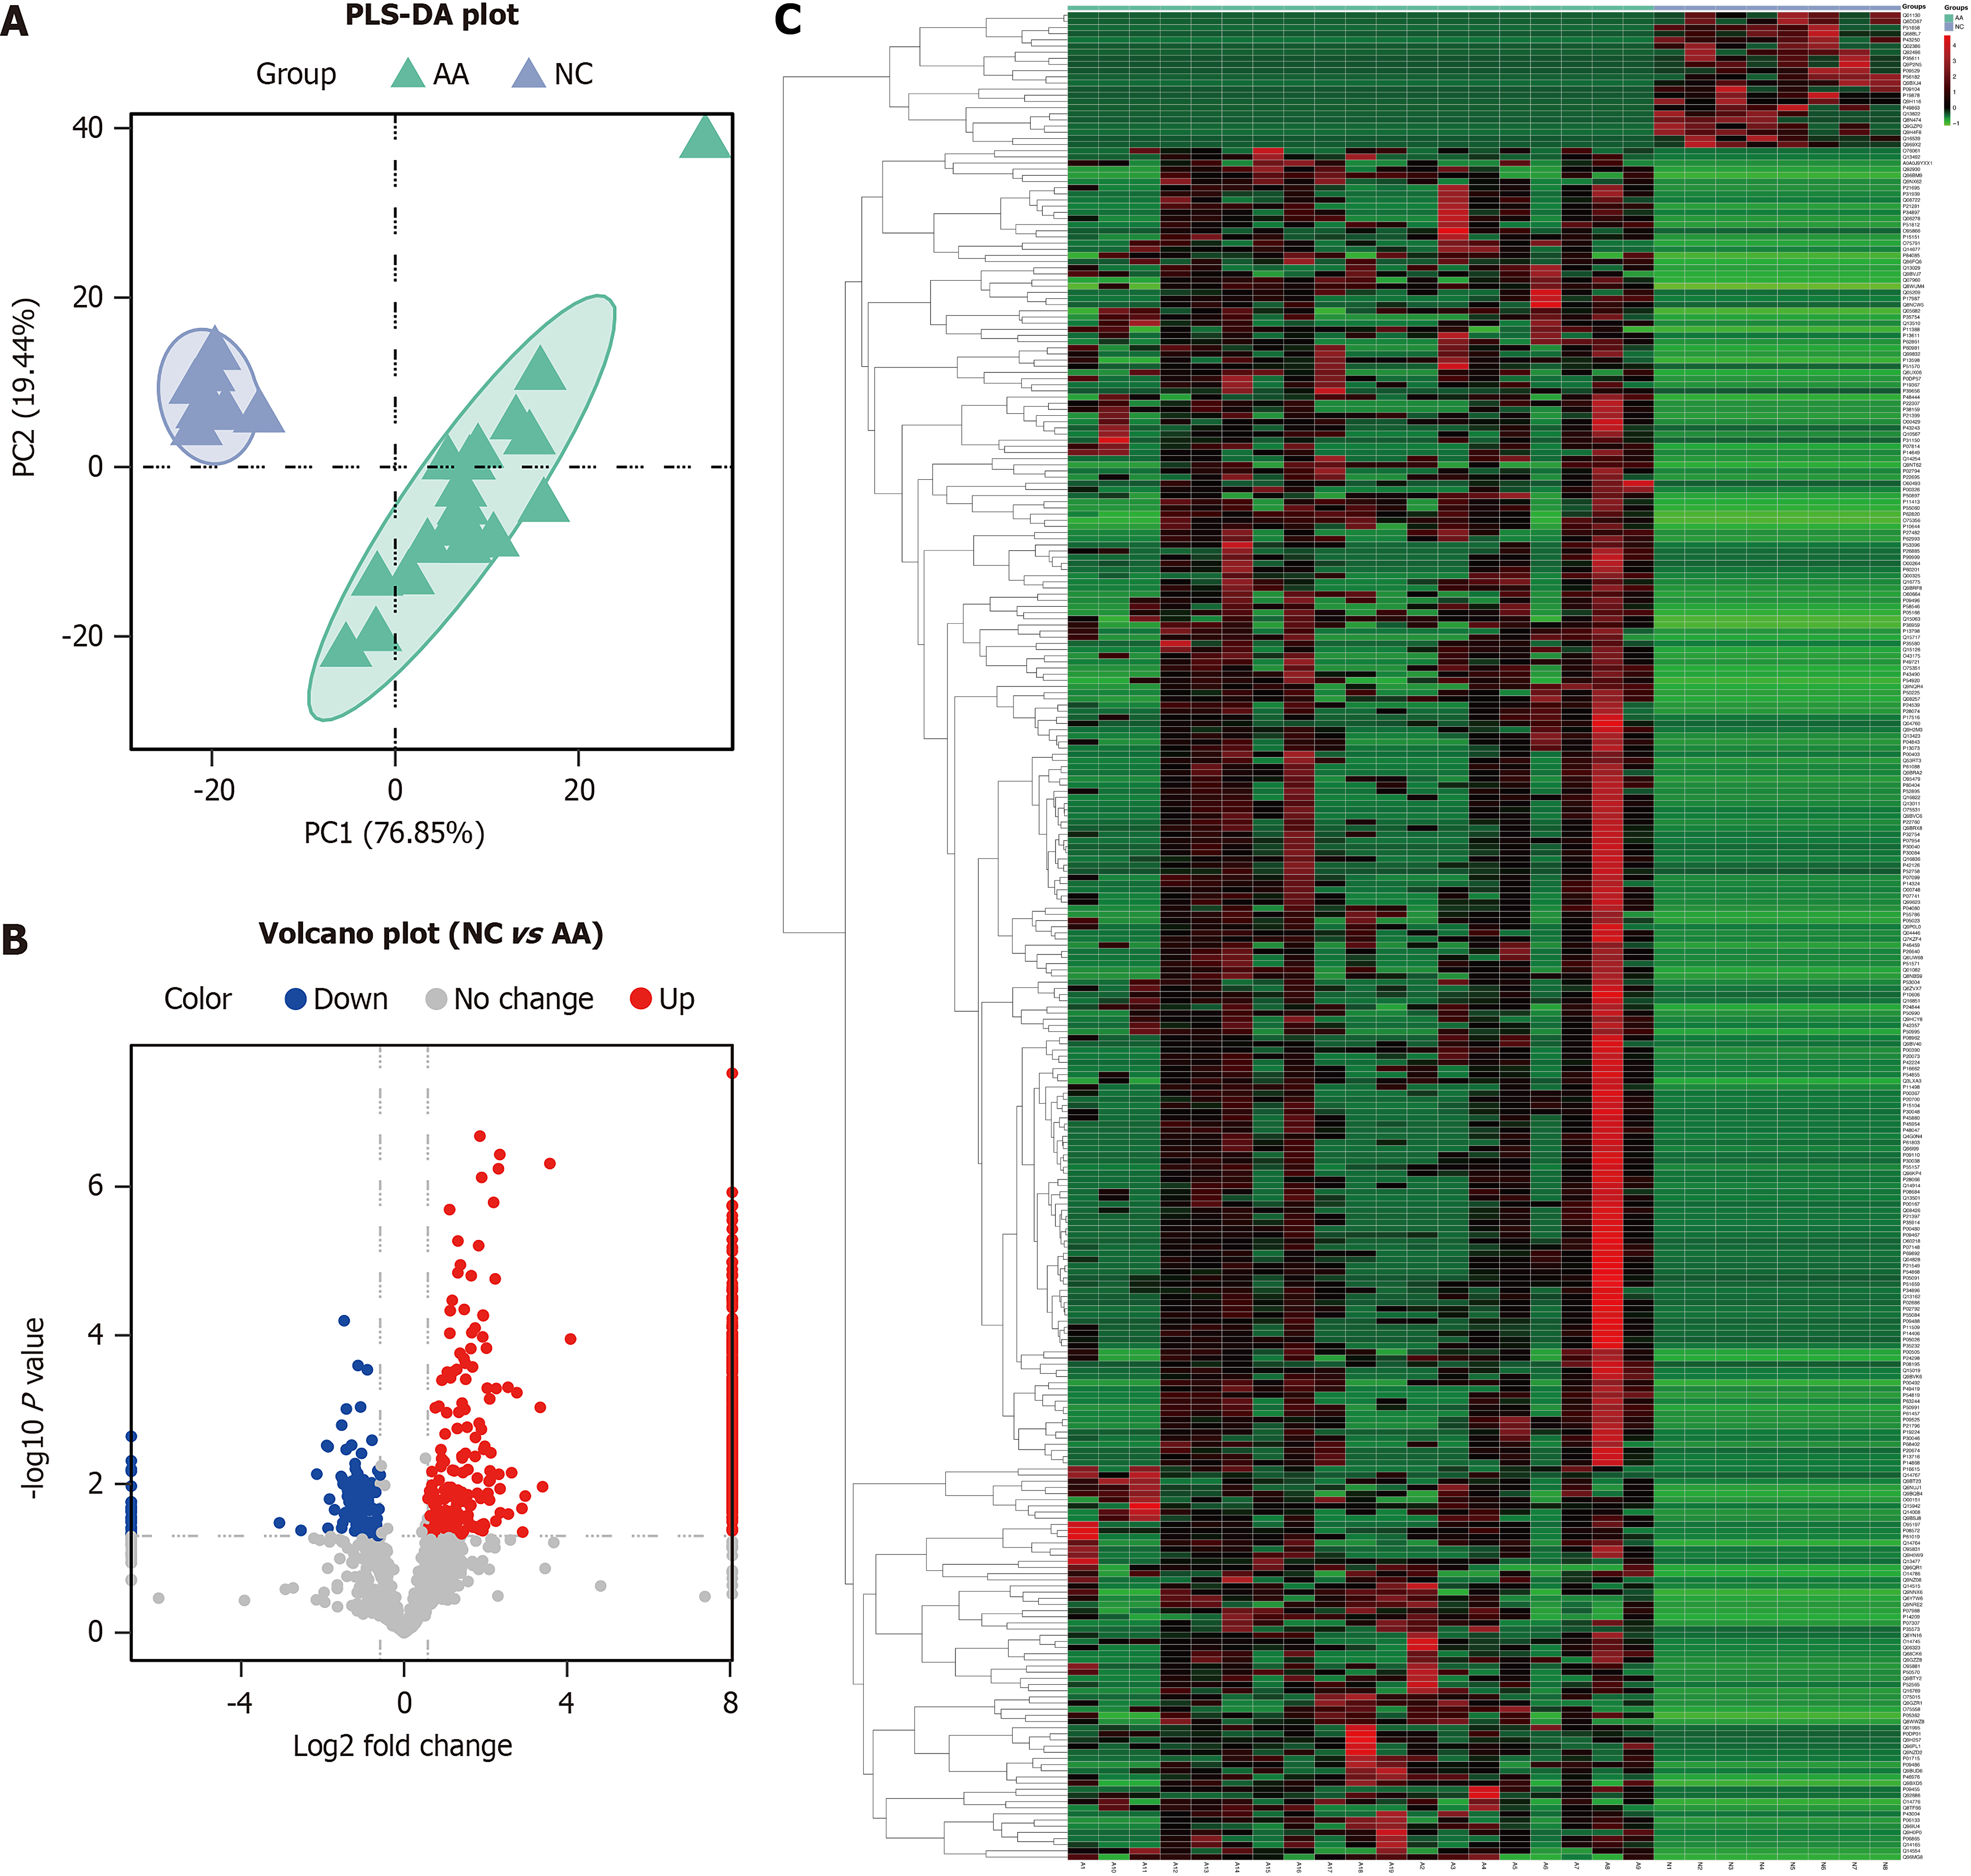
Figure 1 Partial least squares discrimination analysis plot, volcano plot, and heatmap between the normal control group and advanced adenoma group.
A: Partial least squares discrimination analysis shows the protein expression in the normal control group (blue) and advanced adenoma group (green); B: Volcano plot shows the fold change of the identified proteins between the two groups; C: Hierarchical clustering analysis shows the upregulated (red) and downregulated (green) differentially expressed proteins between the two groups. NC: Normal control; AA: Advanced adenoma; PLS-DA: Partial least squares discrimination analysis.
- Citation: Tan C, Qin G, Wang QQ, Li KM, Zhou YC, Yao SK. Comprehensive serum proteomics profiles and potential protein biomarkers for the early detection of advanced adenoma and colorectal cancer. World J Gastrointest Oncol 2024; 16(7): 2971-2987
- URL: https://www.wjgnet.com/1948-5204/full/v16/i7/2971.htm
- DOI: https://dx.doi.org/10.4251/wjgo.v16.i7.2971


