Copyright
©The Author(s) 2024.
World J Gastrointest Oncol. Jun 15, 2024; 16(6): 2826-2841
Published online Jun 15, 2024. doi: 10.4251/wjgo.v16.i6.2826
Published online Jun 15, 2024. doi: 10.4251/wjgo.v16.i6.2826
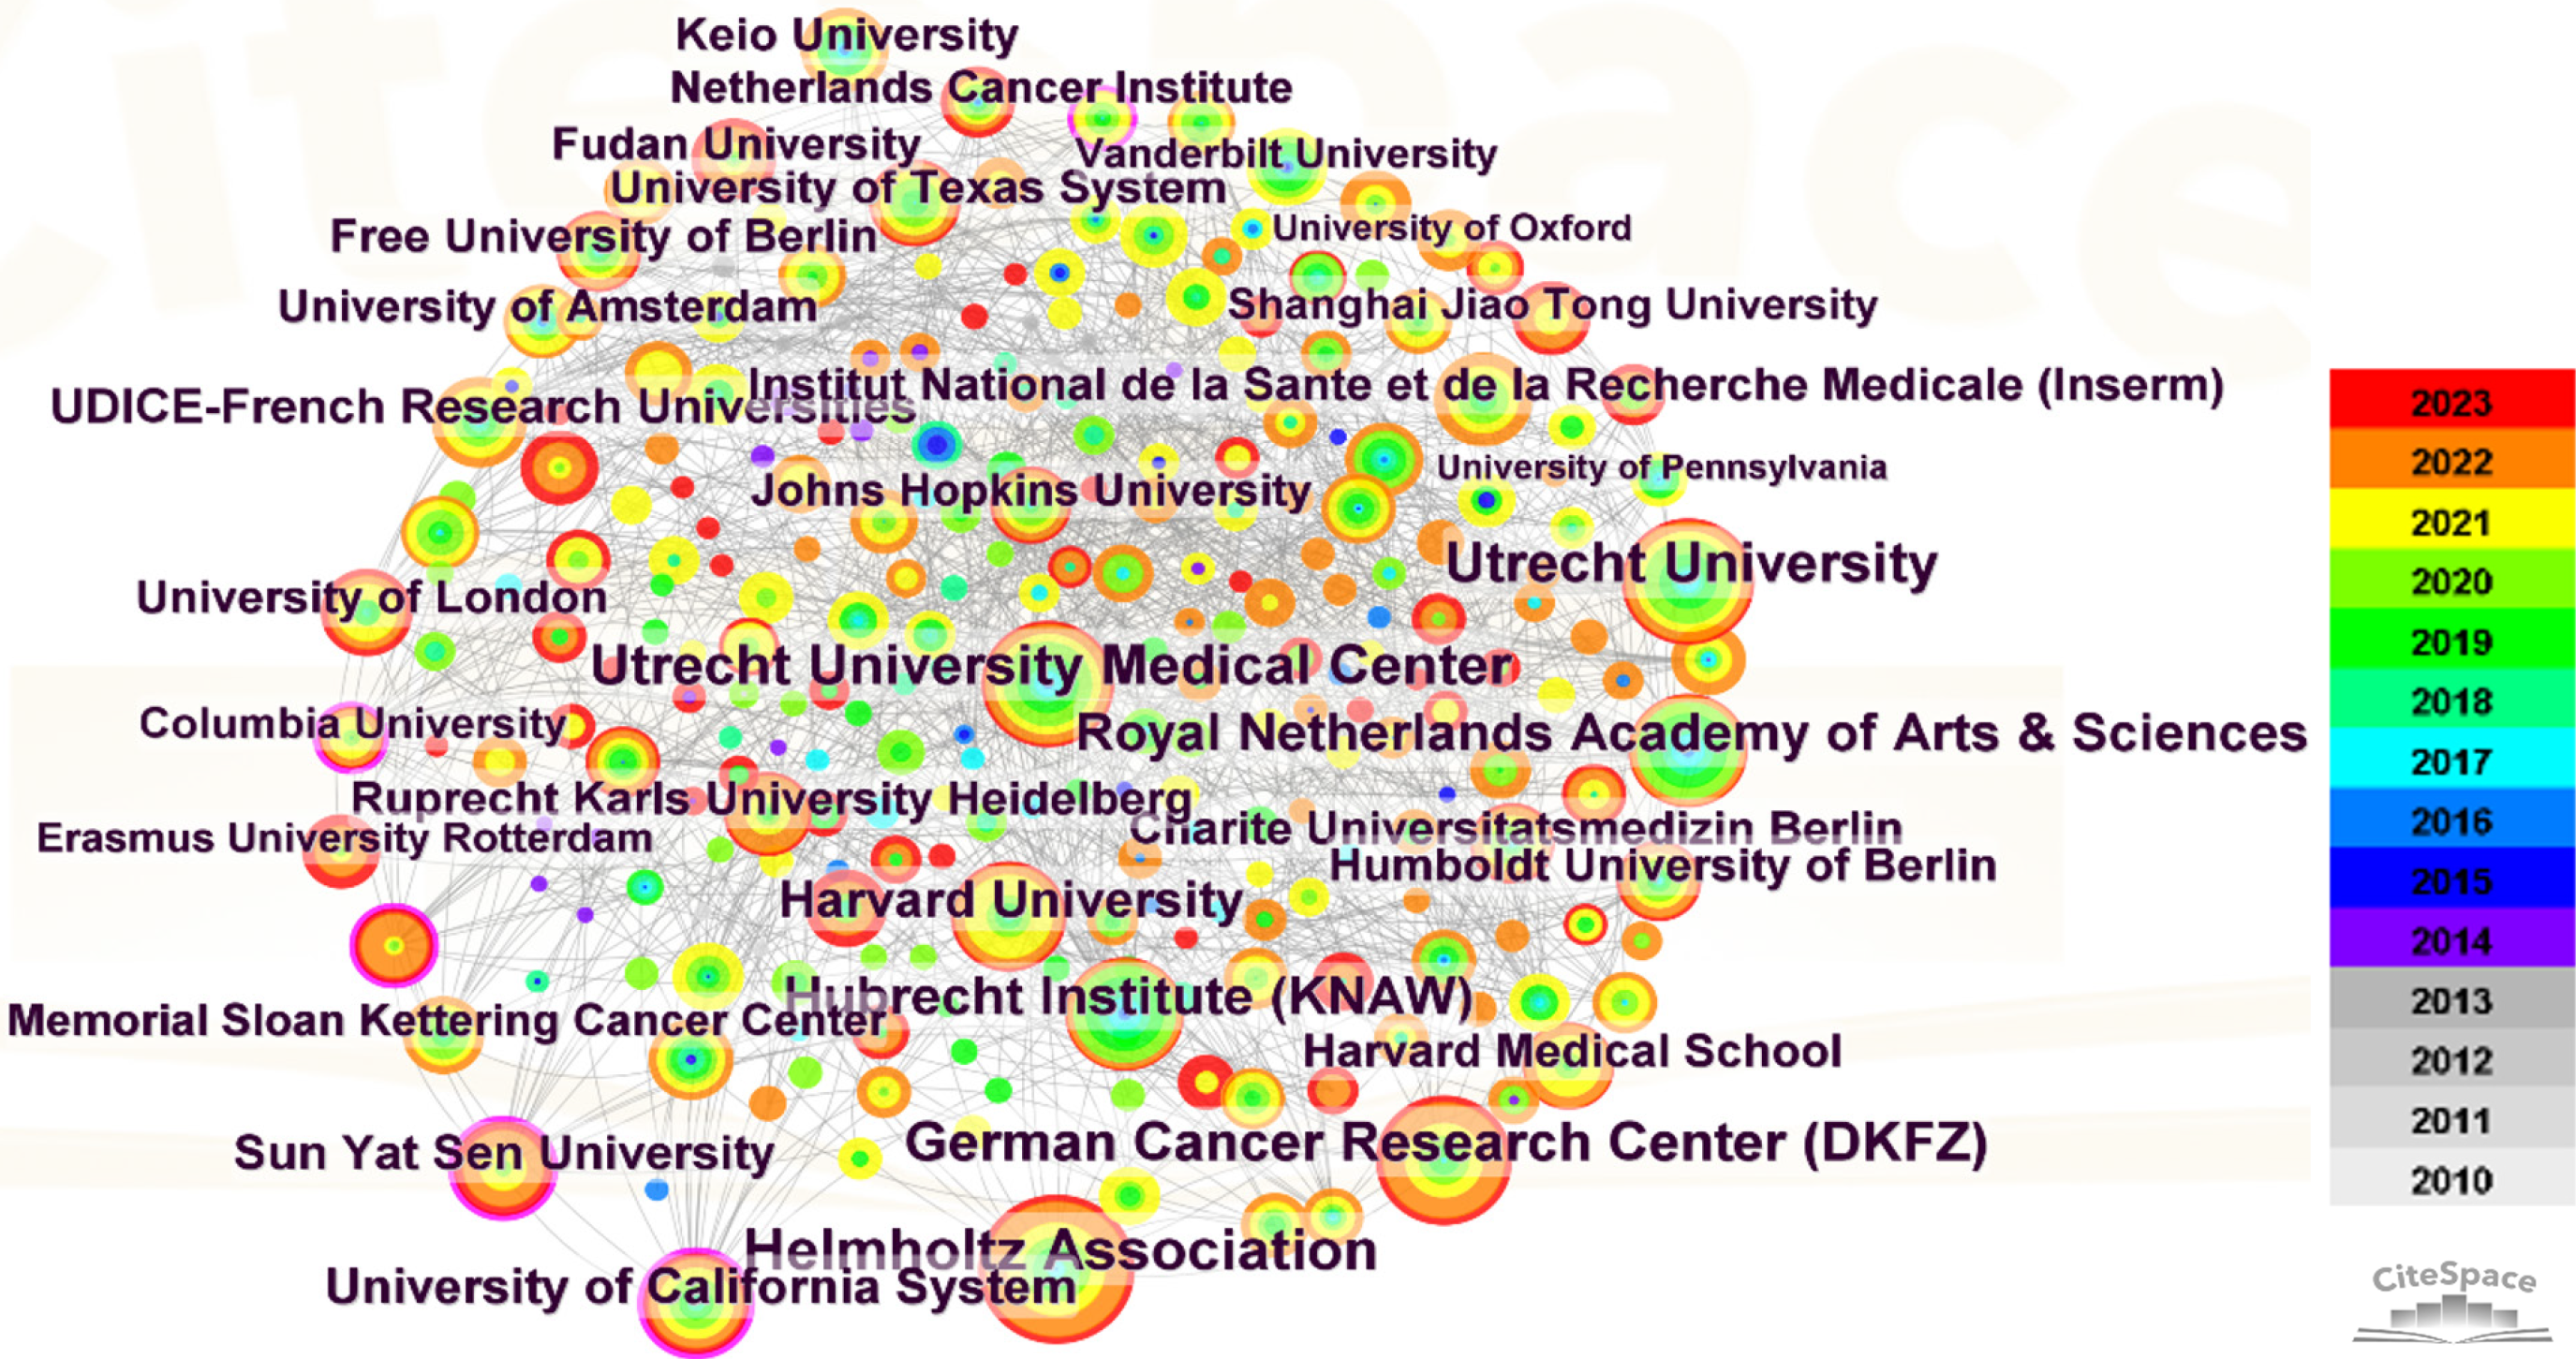
Figure 3 Visualization of the relationship between institutions in the field of gastrointestinal tumor organoids.
The nodes in the figure represent different institutions, and the size of the nodes represents the number of research achievements of the institutions. Different colors represent different years, and the lines between the circles represent cooperative relationships between institutions.
- Citation: Wang G, Liu T, He WT. Visualization analysis of research hotspots and trends on gastrointestinal tumor organoids. World J Gastrointest Oncol 2024; 16(6): 2826-2841
- URL: https://www.wjgnet.com/1948-5204/full/v16/i6/2826.htm
- DOI: https://dx.doi.org/10.4251/wjgo.v16.i6.2826


