Copyright
©The Author(s) 2024.
World J Gastrointest Oncol. Jun 15, 2024; 16(6): 2804-2815
Published online Jun 15, 2024. doi: 10.4251/wjgo.v16.i6.2804
Published online Jun 15, 2024. doi: 10.4251/wjgo.v16.i6.2804
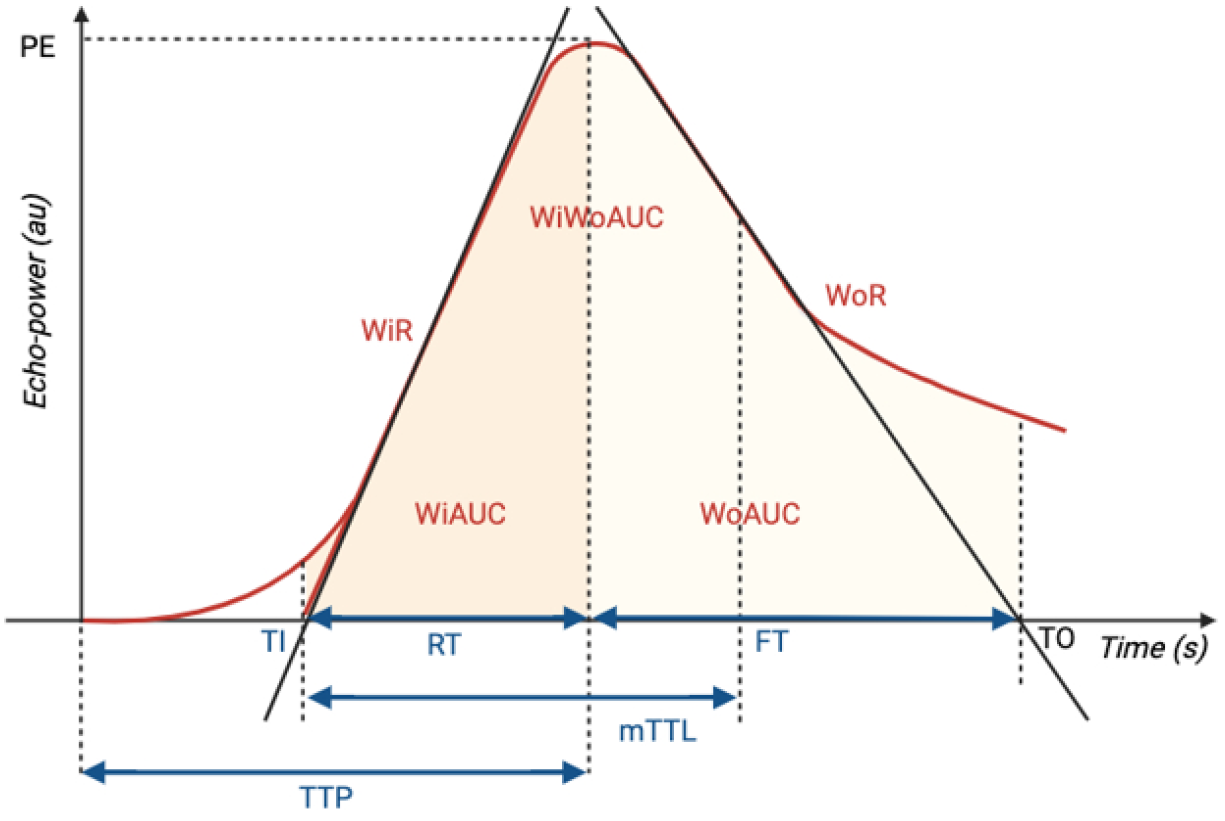
Figure 2 Time-intensity curve.
FT: Fall time; mTTL: Mean transit time local; PE: Peak enhancemetn; RT: Rise time; TI: The point in time when the tangent of WiR intersects the x-axis.; TO: The point in time when the tangent of the maximum decrease intersects the x-axis; TTP: Time to peak; WiAUC: Wash-in area under the curve; WiR: Wash-in rate; WoR: Wash-out rate; WoAUC: Wash-out area under the curve; WiWoAUC: Wash-in and wash-out area under the curve.
- Citation: Esposto G, Santini P, Termite F, Galasso L, Mignini I, Ainora ME, Gasbarrini A, Zocco MA. Dynamic contrast enhanced ultrasound in differential diagnosis of hepatocellular carcinoma: A systematic review and meta-analysis. World J Gastrointest Oncol 2024; 16(6): 2804-2815
- URL: https://www.wjgnet.com/1948-5204/full/v16/i6/2804.htm
- DOI: https://dx.doi.org/10.4251/wjgo.v16.i6.2804


