Copyright
©The Author(s) 2024.
World J Gastrointest Oncol. Jun 15, 2024; 16(6): 2757-2768
Published online Jun 15, 2024. doi: 10.4251/wjgo.v16.i6.2757
Published online Jun 15, 2024. doi: 10.4251/wjgo.v16.i6.2757
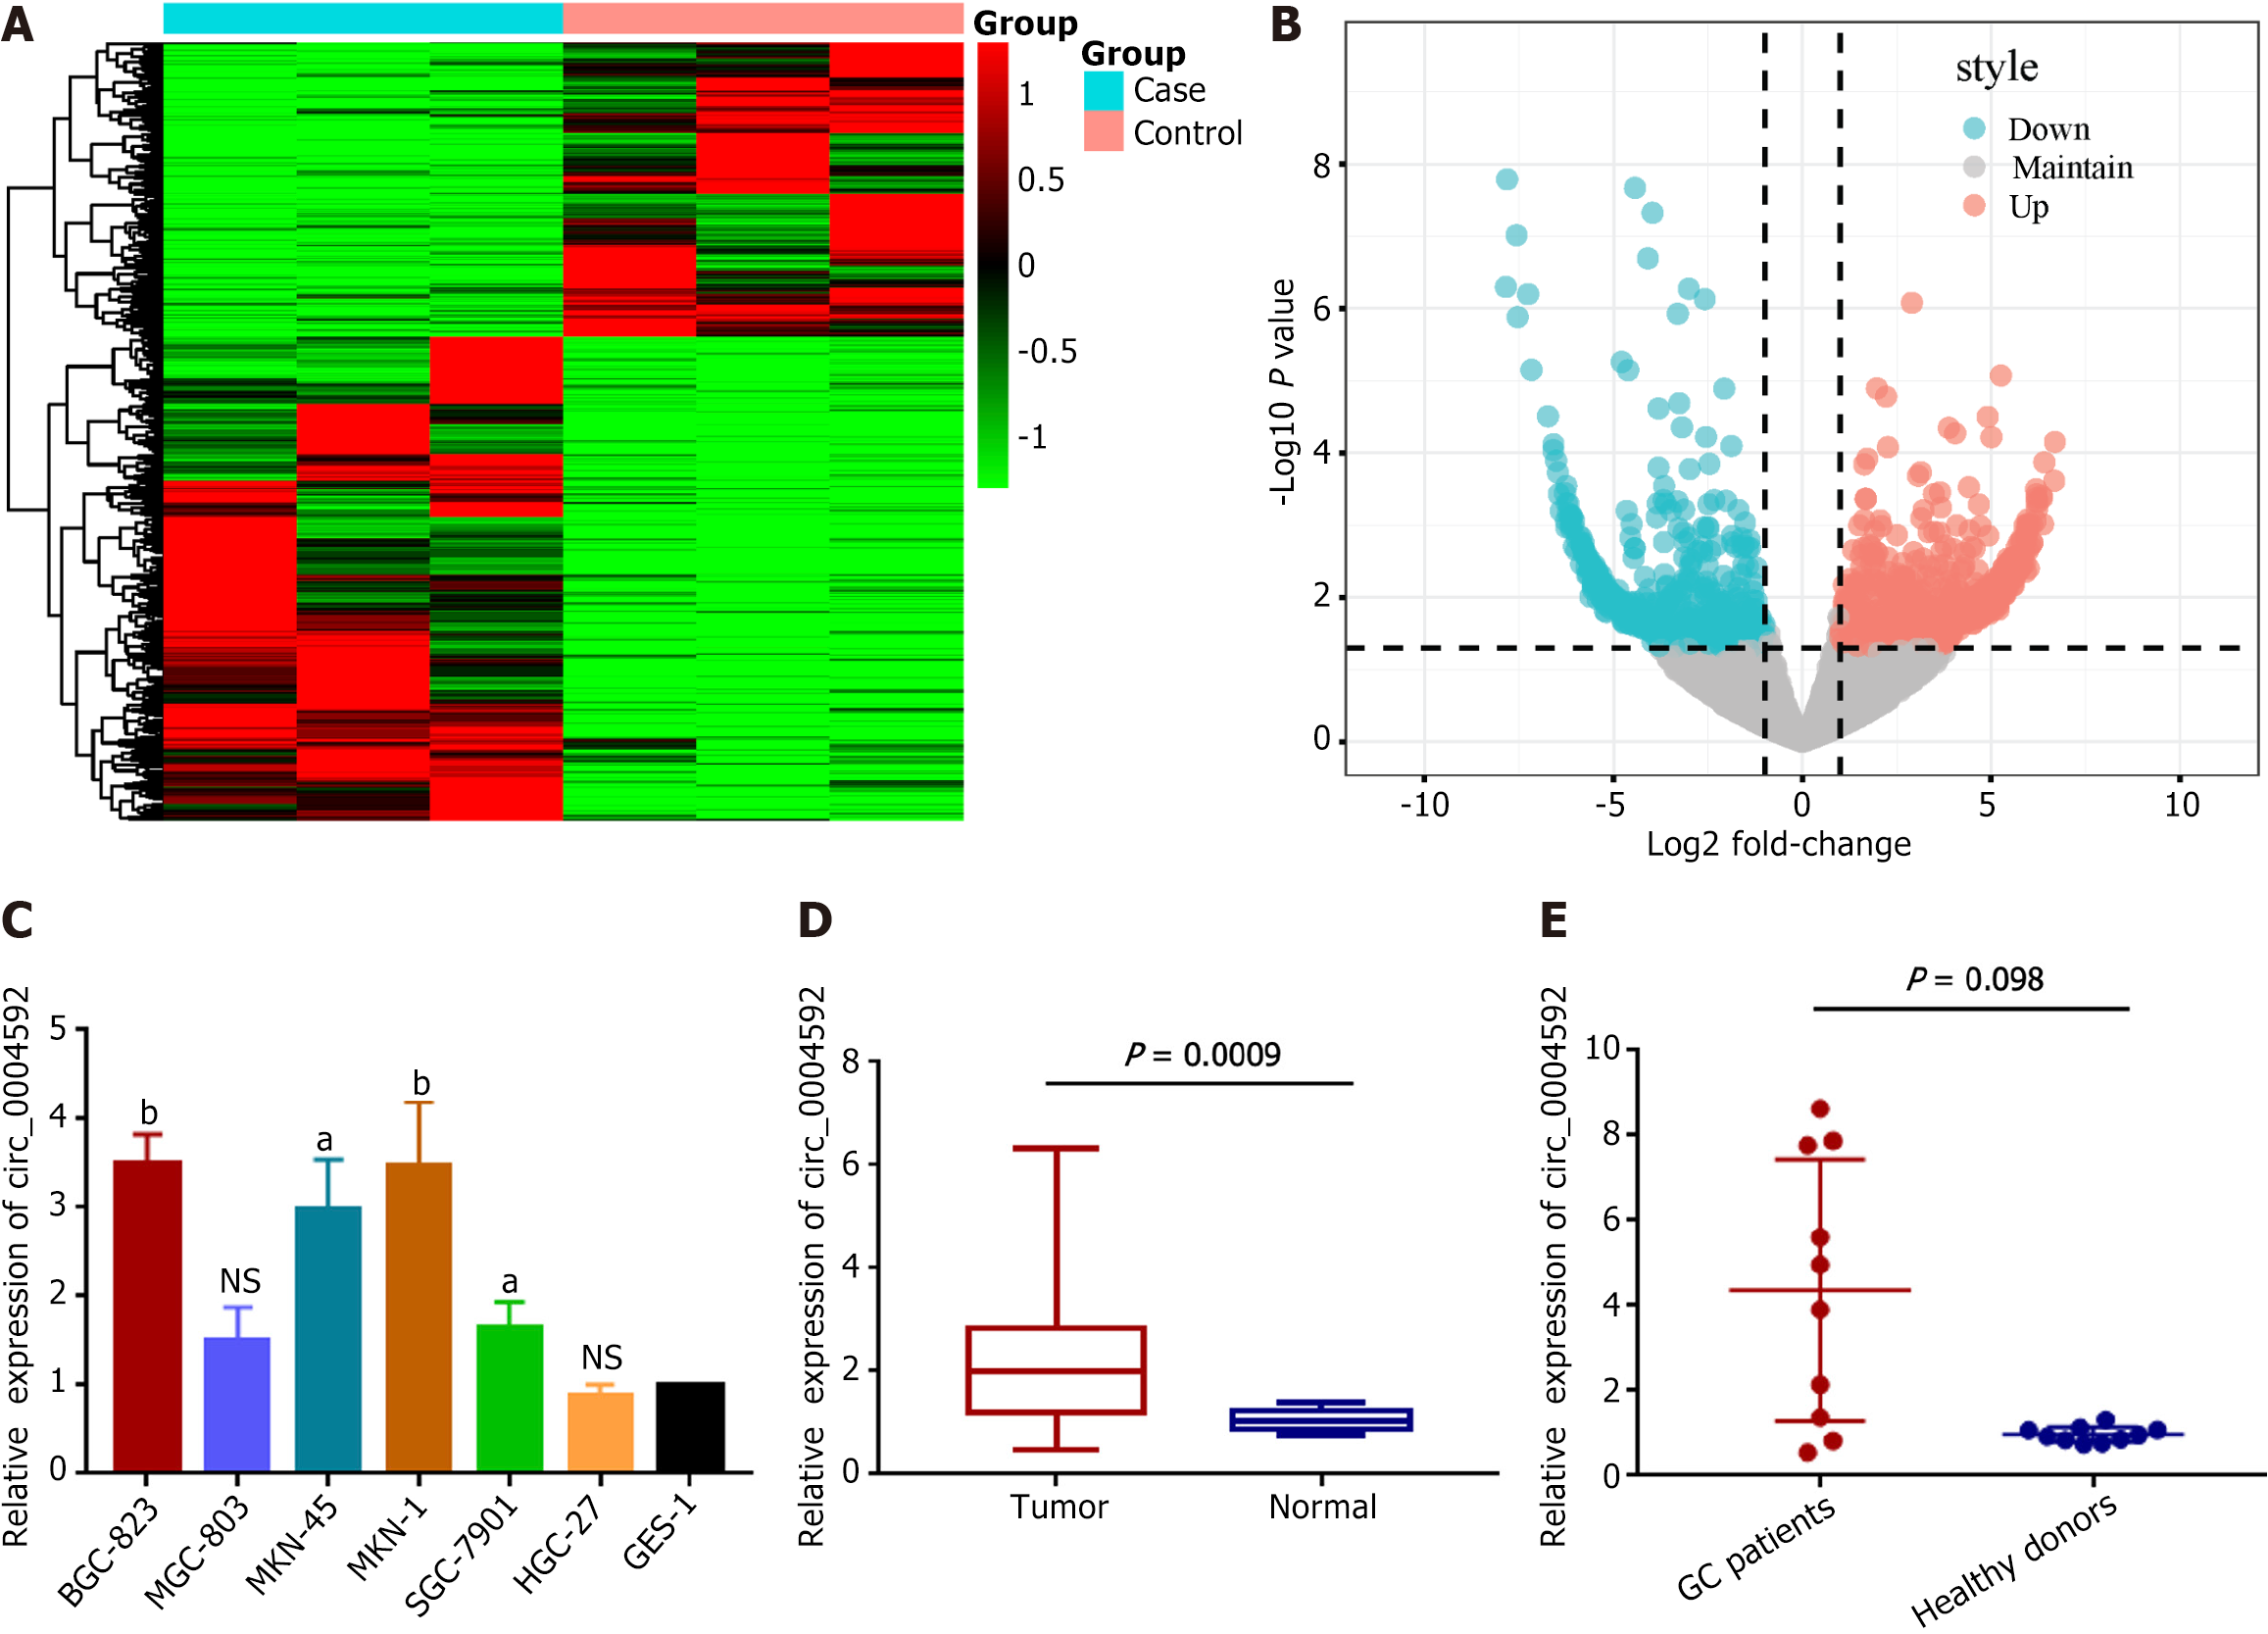
Figure 1 The expression profile of circular RNA.
A: Hierarchical clustering results of circular RNA (circRNA) expression profiles between the gastric cancer (GC) tissues and matched normal tissues (the three columns in blue represent the case group, representing the cancer tissue specimens of three GC patients, and the three columns in pink represent the control group, representing the para-cancer tissue specimens matched by the cancer tissues of three GC patients. Each grid represents each gene, and the color indicates up-regulated/down-regulated expression of that gene, with red indicating up-regulated expression and green indicating down-regulated expression); B: Volcano plot of circRNA expression profile; C: The expression level of circ_0004592 in GC cell lines (BGC-823, MGC-803, MKN-45, MKN-1, SGC-7901, and HGC-27); D: The expression level of circ_0004592 in GC tissues (n = 20); E: The expression level of circ_0004592 in GC patients (n = 10). aP < 0.05; bP < 0.01.
- Citation: Kong S, Xu YH, Zheng M, Ju SQ, Shi HC. Circ_0004592: An auxiliary diagnostic biomarker for gastric cancer. World J Gastrointest Oncol 2024; 16(6): 2757-2768
- URL: https://www.wjgnet.com/1948-5204/full/v16/i6/2757.htm
- DOI: https://dx.doi.org/10.4251/wjgo.v16.i6.2757


