Copyright
©The Author(s) 2024.
World J Gastrointest Oncol. Jun 15, 2024; 16(6): 2727-2741
Published online Jun 15, 2024. doi: 10.4251/wjgo.v16.i6.2727
Published online Jun 15, 2024. doi: 10.4251/wjgo.v16.i6.2727
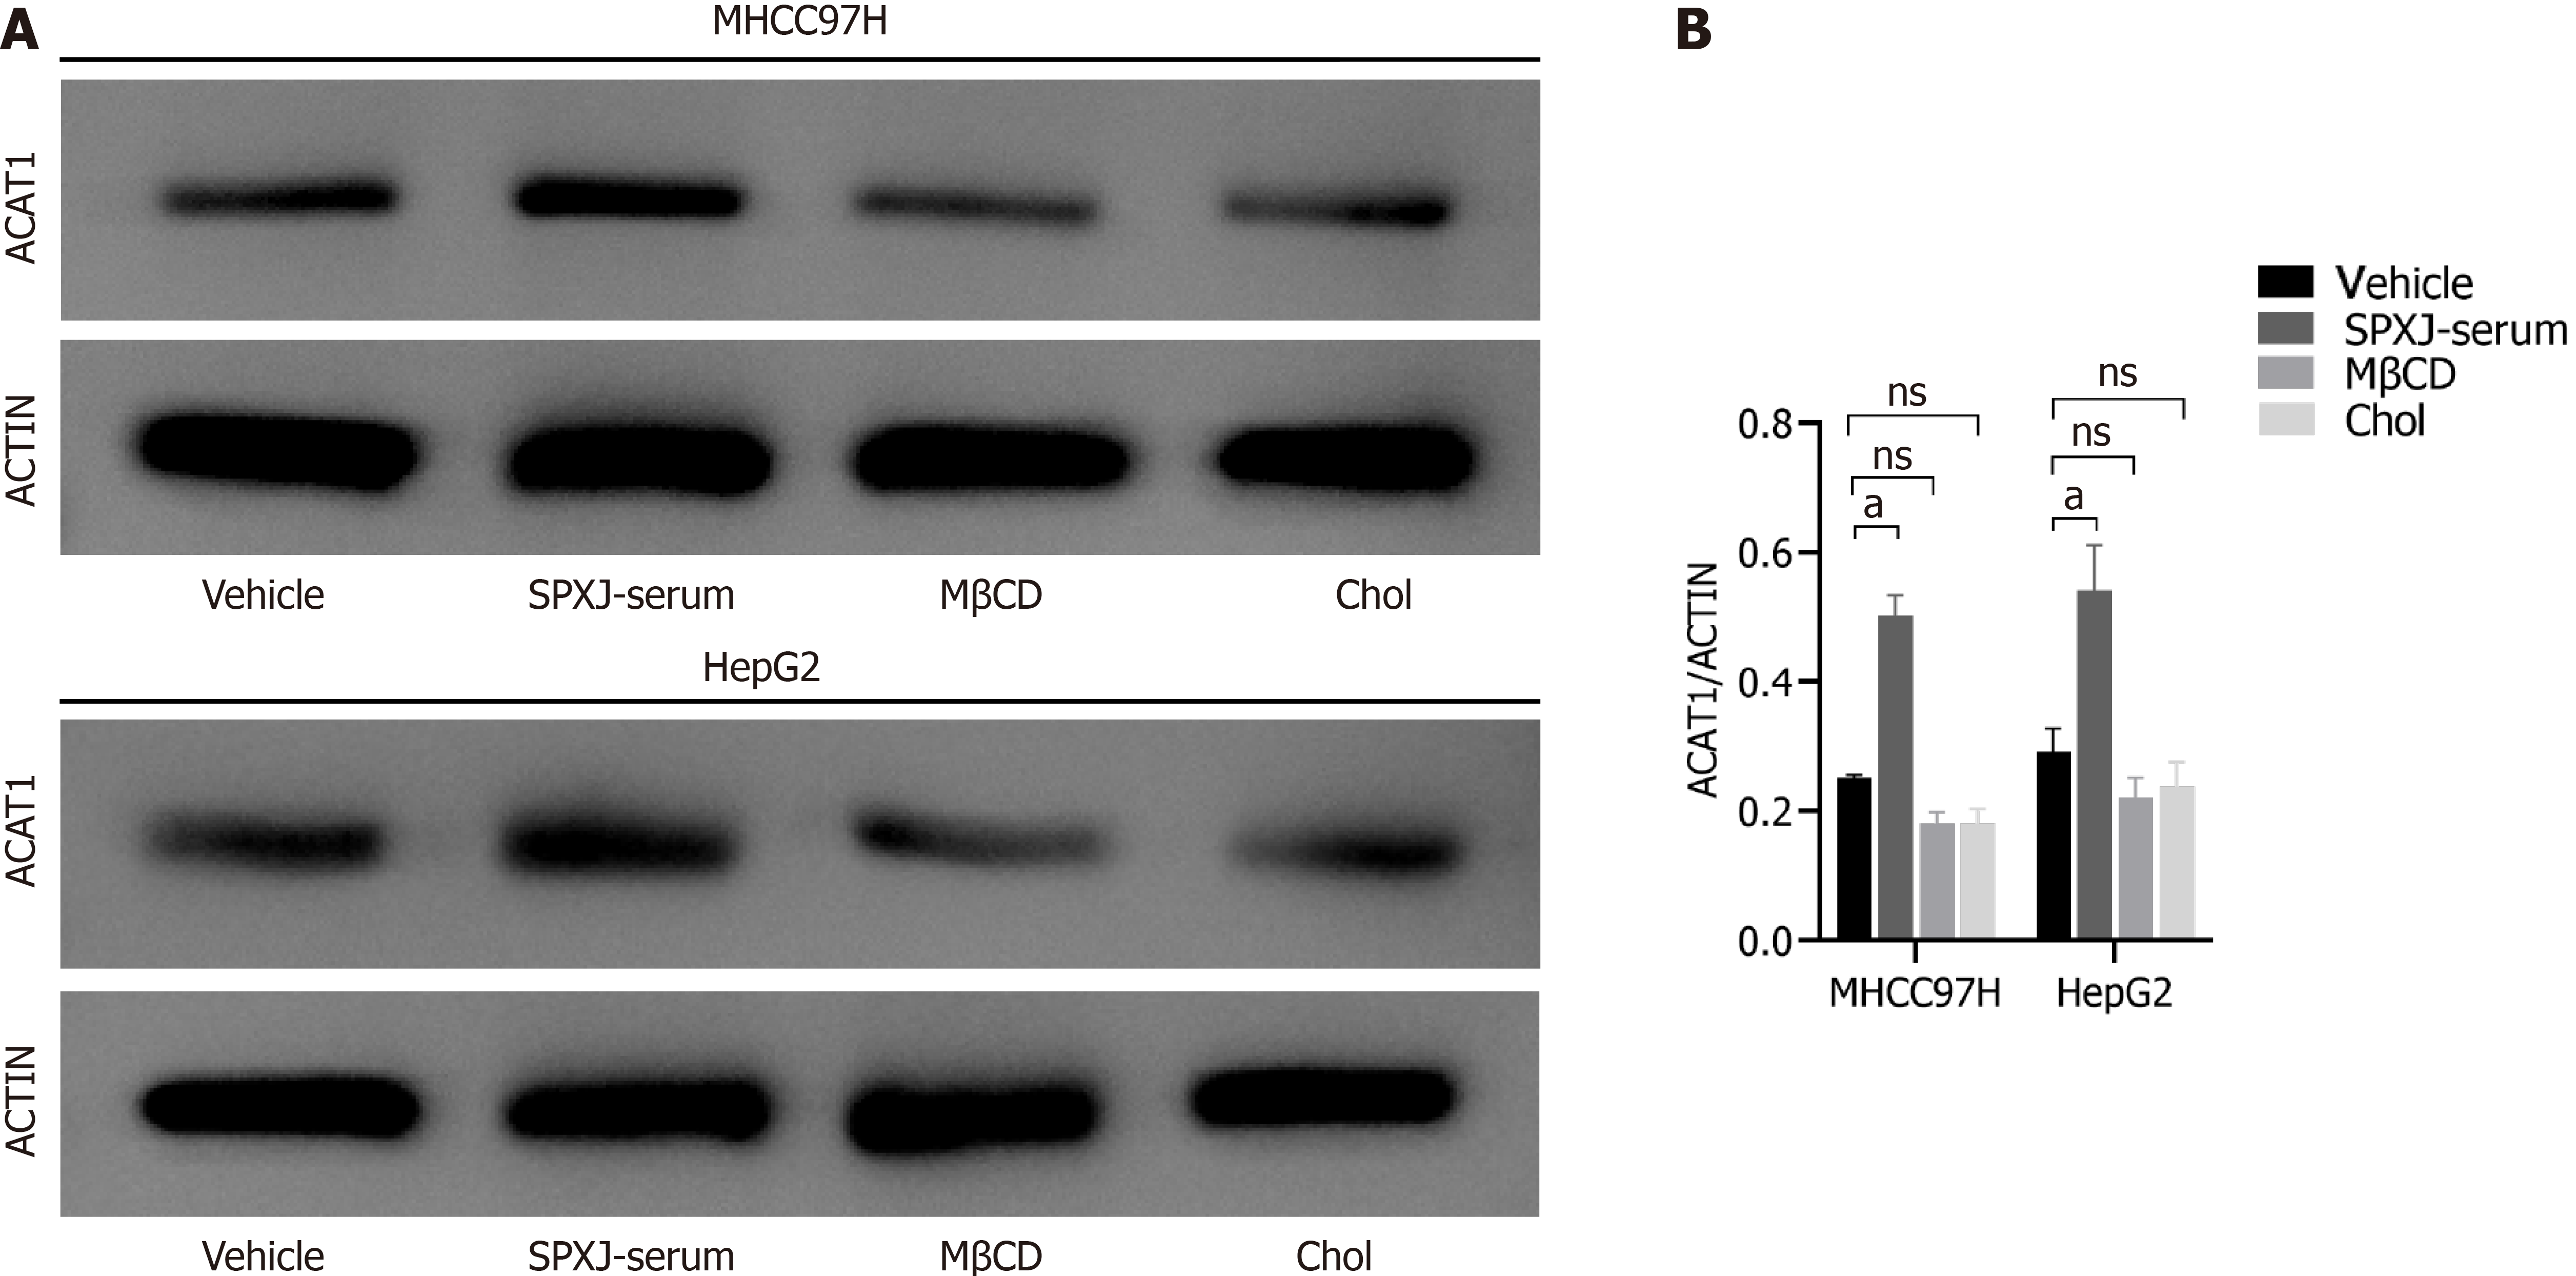
Figure 7 Western blot analysis of acetyl-coA acetyltransferase 1 protein expression levels.
A: Representative image shows the expression of acetyl-coA acetyltransferase 1 (ACAT1) protein in vehicle, Shi-pi-xiao-ji (SPXJ)-serum, methyl-β-cyclodextrin (MβCD), and water-soluble cholesterol (Chol) groups of MHCC97H and HepG2 cells. Actin was used as loading control; B: Histogram plots show the relative expression levels of ACAT1 protein in the vehicle, SPXJ-serum, MβCD, and Chol groups of MHCC97H and HepG2 cells. The results are expressed as means ± SEM (n= 3). aP < 0.01, ns: P > 0.05. SPXJ: Shi-pi-xiao-ji; MβCD: Methyl-β-cyclodextrin; Chol: Water-soluble cholesterol; ACAT1: Acetyl-coA acetyltransferase 1.
- Citation: Jian HY, Liang ZC, Wen H, Zhang Z, Zeng PH. Shi-pi-xiao-ji formula suppresses hepatocellular carcinoma by reducing cellular stiffness through upregulation of acetyl-coA acetyltransferase 1. World J Gastrointest Oncol 2024; 16(6): 2727-2741
- URL: https://www.wjgnet.com/1948-5204/full/v16/i6/2727.htm
- DOI: https://dx.doi.org/10.4251/wjgo.v16.i6.2727


