Copyright
©The Author(s) 2024.
World J Gastrointest Oncol. Jun 15, 2024; 16(6): 2716-2726
Published online Jun 15, 2024. doi: 10.4251/wjgo.v16.i6.2716
Published online Jun 15, 2024. doi: 10.4251/wjgo.v16.i6.2716
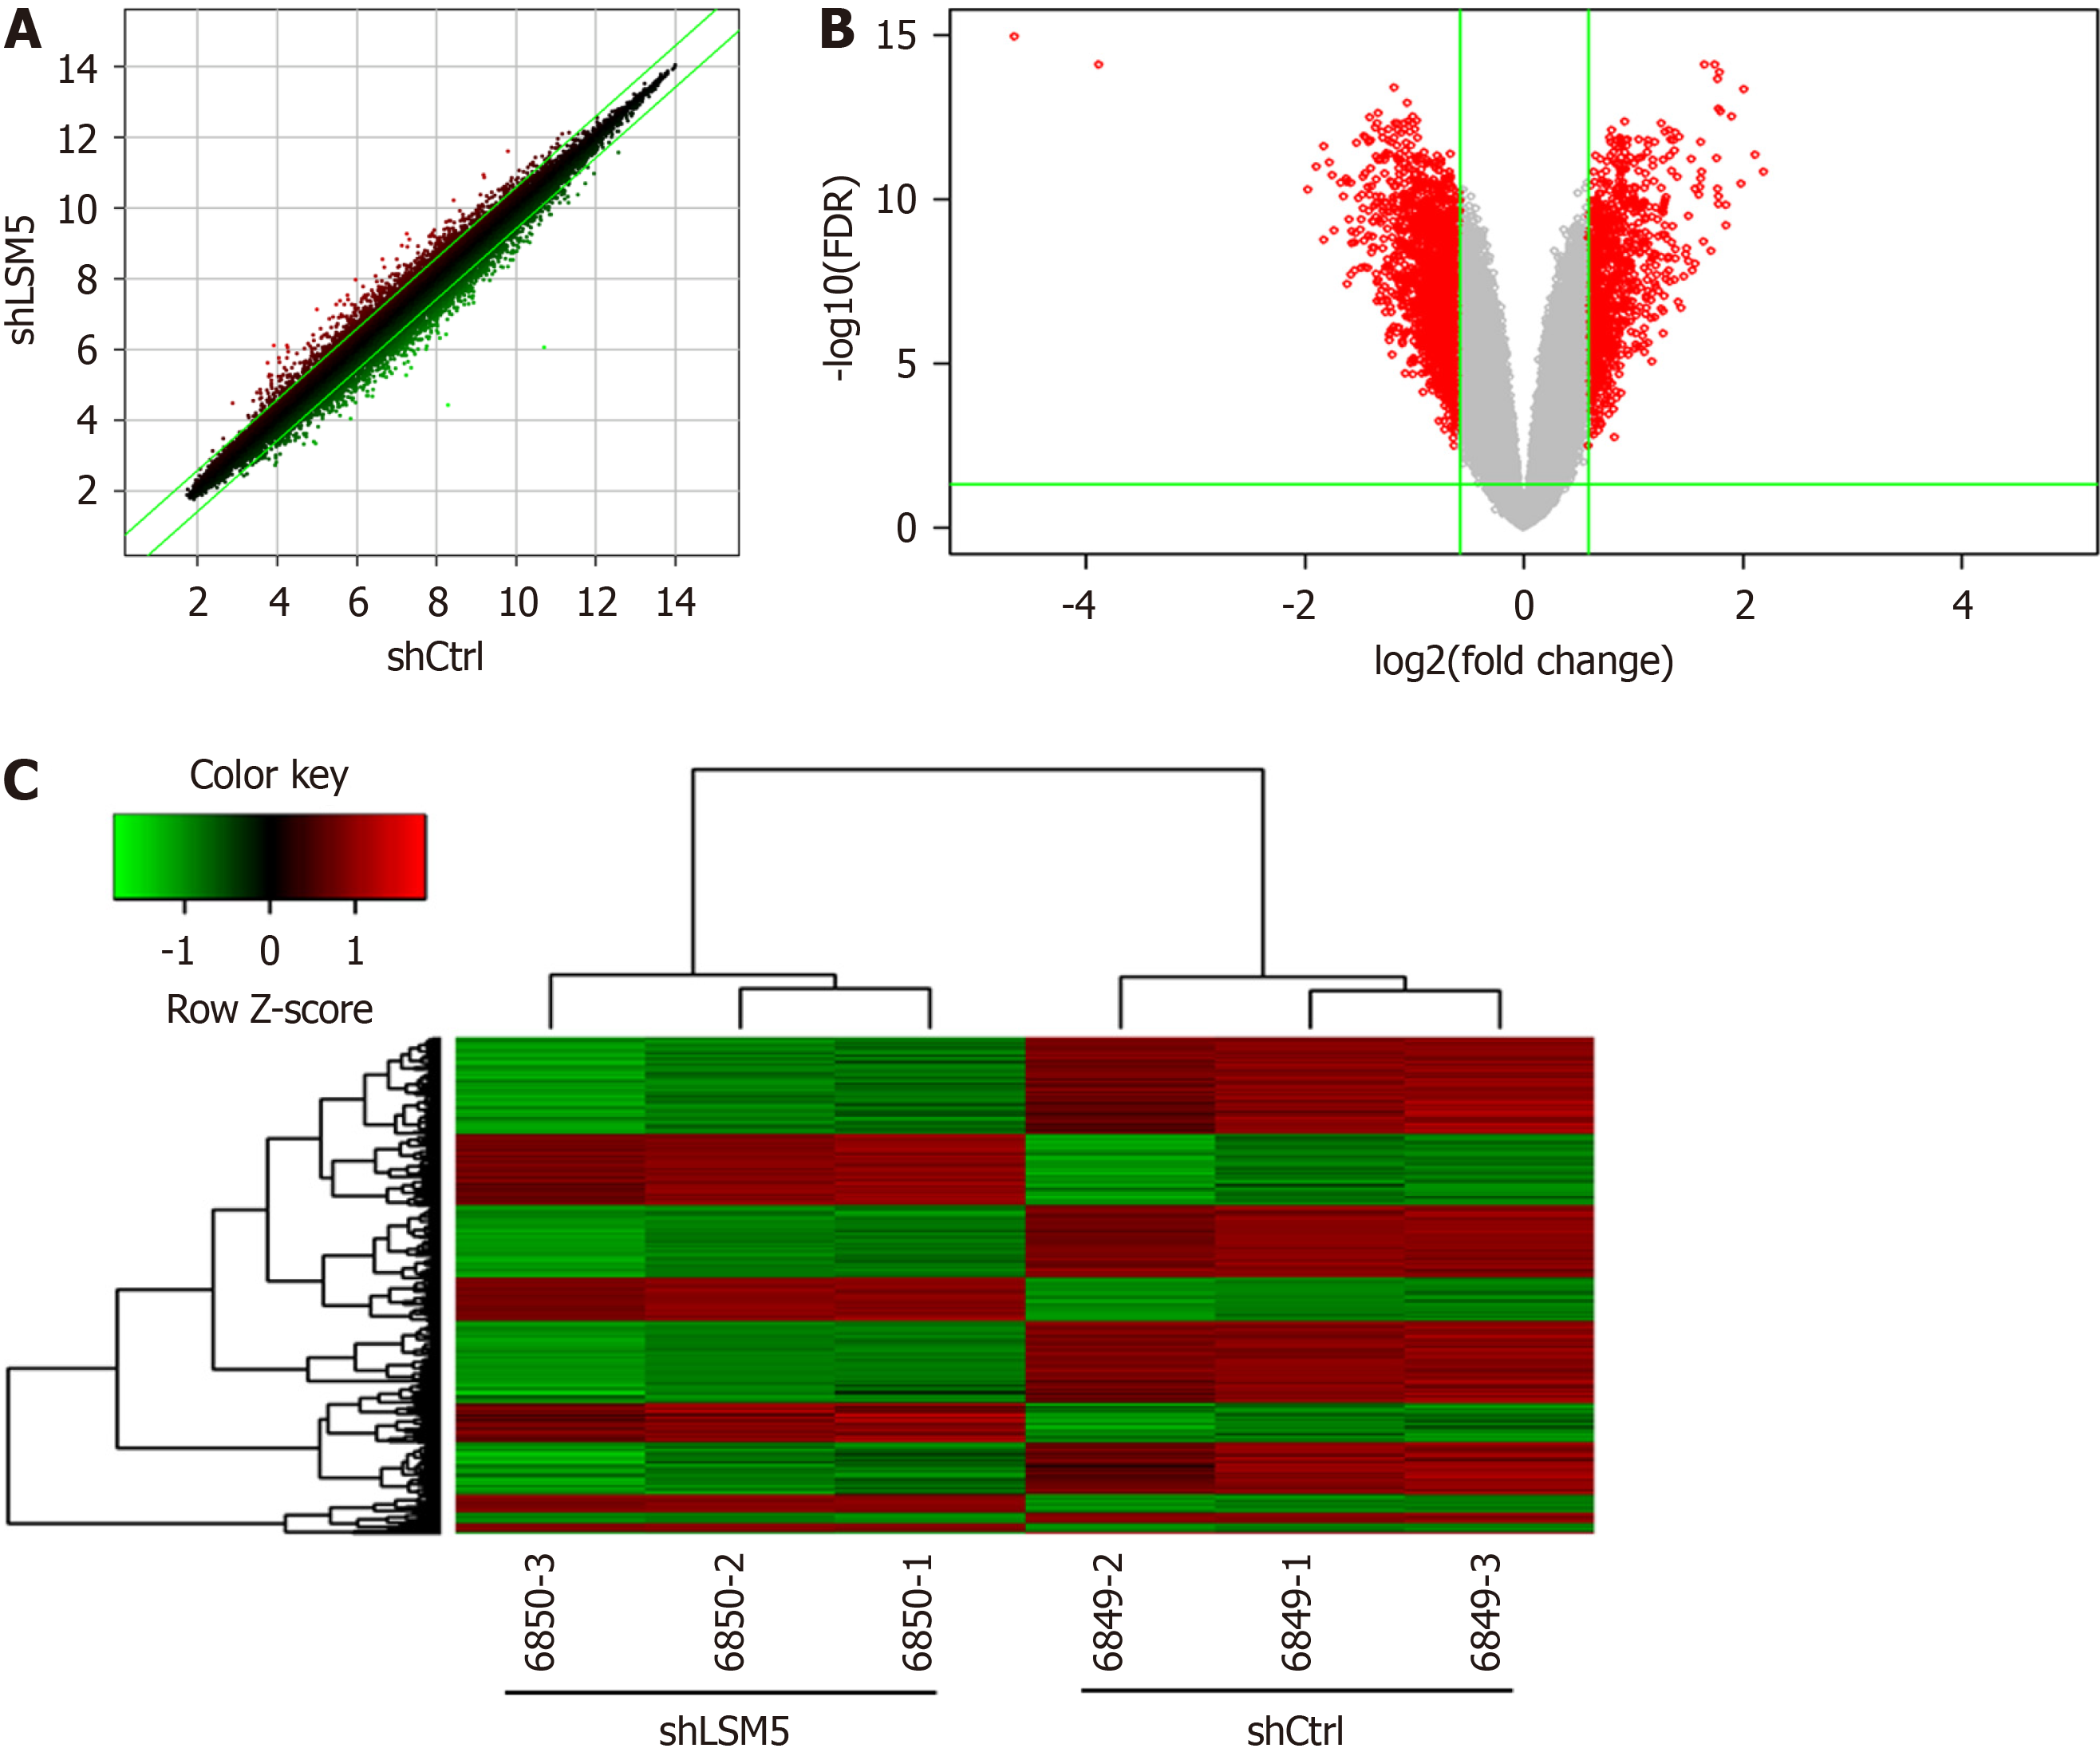
Figure 5 Microarray assay and differentially expressed genes analysis after Sm-like 5 knockdown.
Scatter plot, volcano plot and hierarchical clustering analysis showing 757 upregulated genes and 1318 downregulated genes following Sm-like 5 knockdown. A: Scatter plot; B: Volcano plot; C: Hierarchical clustering analysis. DEG: differentially expressed gene; LSM5: Sm-like 5.
- Citation: Mo CJ, Deng XY, Ma RL, Zhu K, Shi L, Li K. Sm-like 5 knockdown inhibits proliferation and promotes apoptosis of colon cancer cells by upregulating p53, CDKN1A and TNFRSF10B. World J Gastrointest Oncol 2024; 16(6): 2716-2726
- URL: https://www.wjgnet.com/1948-5204/full/v16/i6/2716.htm
- DOI: https://dx.doi.org/10.4251/wjgo.v16.i6.2716


