Copyright
©The Author(s) 2024.
World J Gastrointest Oncol. Jun 15, 2024; 16(6): 2646-2662
Published online Jun 15, 2024. doi: 10.4251/wjgo.v16.i6.2646
Published online Jun 15, 2024. doi: 10.4251/wjgo.v16.i6.2646
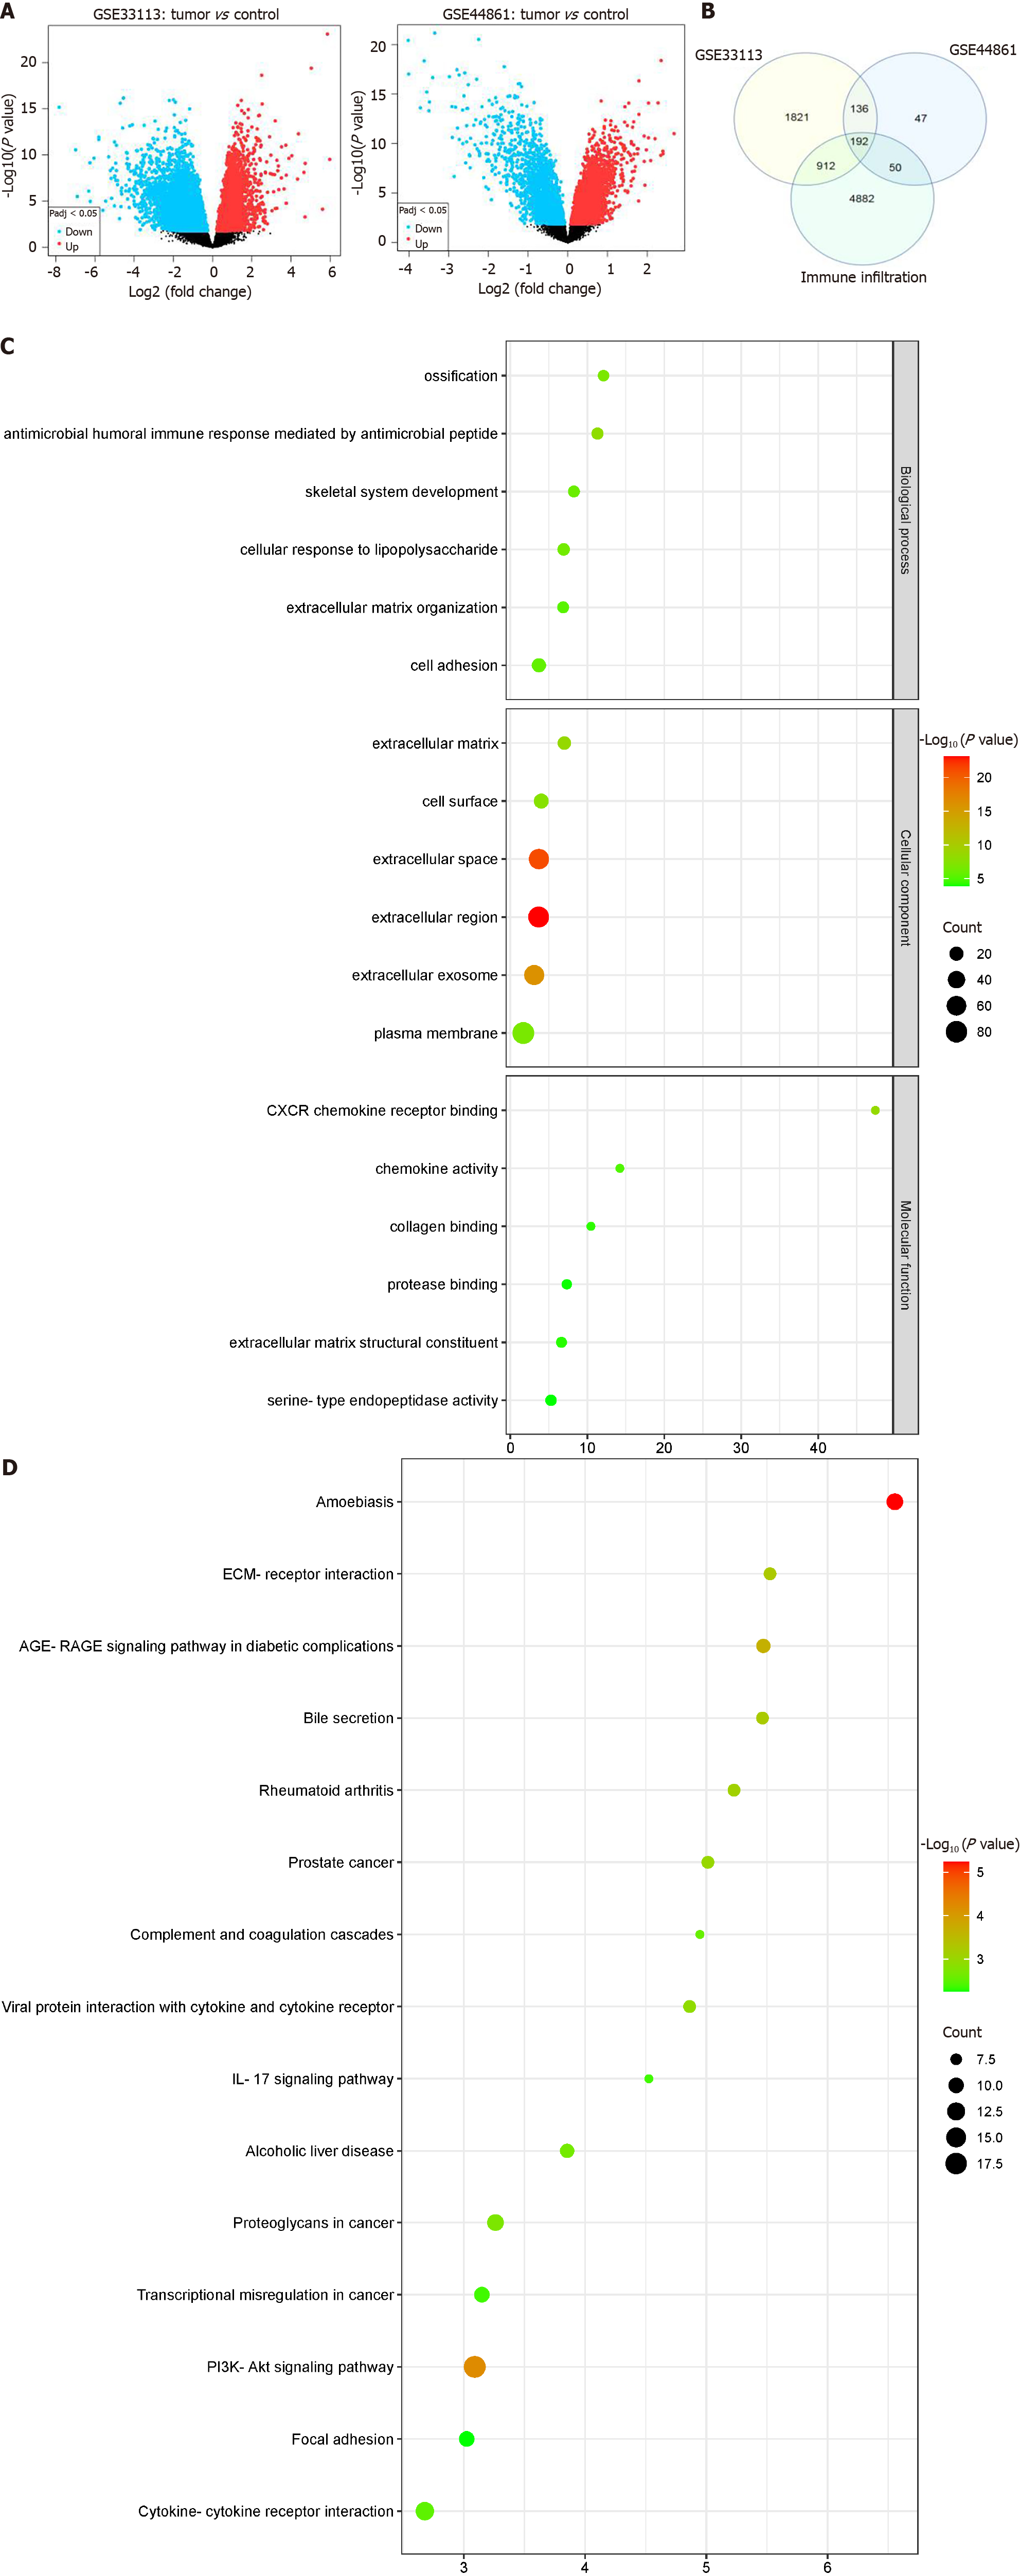
Figure 1 Immune infiltration-associated differentially expressed genes were screened and functional enrichment analysis.
A: Volcano plot of differentially expressed genes (DEGs) between tumor and control in GSE33113 and GSE44861 datasets, respectively. Horizontal coordinates represent log2 fold change and vertical coordinates represent -log10 (P value). Red dots indicate up-regulated genes, blue dots indicate down-regulated genes, and black dots indicate non-significant differentially expressed genes; B: Immune infiltration-associated DEGs were shown in the Venn diagram. DEGs in the GSE44861 dataset were shown in the blue circle, DEGs in the GSE33113 dataset were shown in the yellow circle, and the immune infiltration-related gene set was shown in the green circle. The intersecting parts of the three circles were shared immune infiltration-associated DEGs; C: Bubble chart illustrating the Gene Ontology (GO) enrichment analysis results for the DEGs. Horizontal coordinate represents GO terms, and vertical coordinate represents -log10 (P value); D: The results of Kyoto Encyclopedia of Genes and Genomes functional enrichment analysis for the DEGs were visualized in the Bubble chart. The horizontal coordinate denotes -log10 (P value), and the vertical coordinate denotes the pathway name.
- Citation: Du YJ, Jiang Y, Hou YM, Shi YB. Complement factor I knockdown inhibits colon cancer development by affecting Wnt/β-catenin/c-Myc signaling pathway and glycolysis. World J Gastrointest Oncol 2024; 16(6): 2646-2662
- URL: https://www.wjgnet.com/1948-5204/full/v16/i6/2646.htm
- DOI: https://dx.doi.org/10.4251/wjgo.v16.i6.2646


