Copyright
©The Author(s) 2024.
World J Gastrointest Oncol. Jun 15, 2024; 16(6): 2571-2591
Published online Jun 15, 2024. doi: 10.4251/wjgo.v16.i6.2571
Published online Jun 15, 2024. doi: 10.4251/wjgo.v16.i6.2571
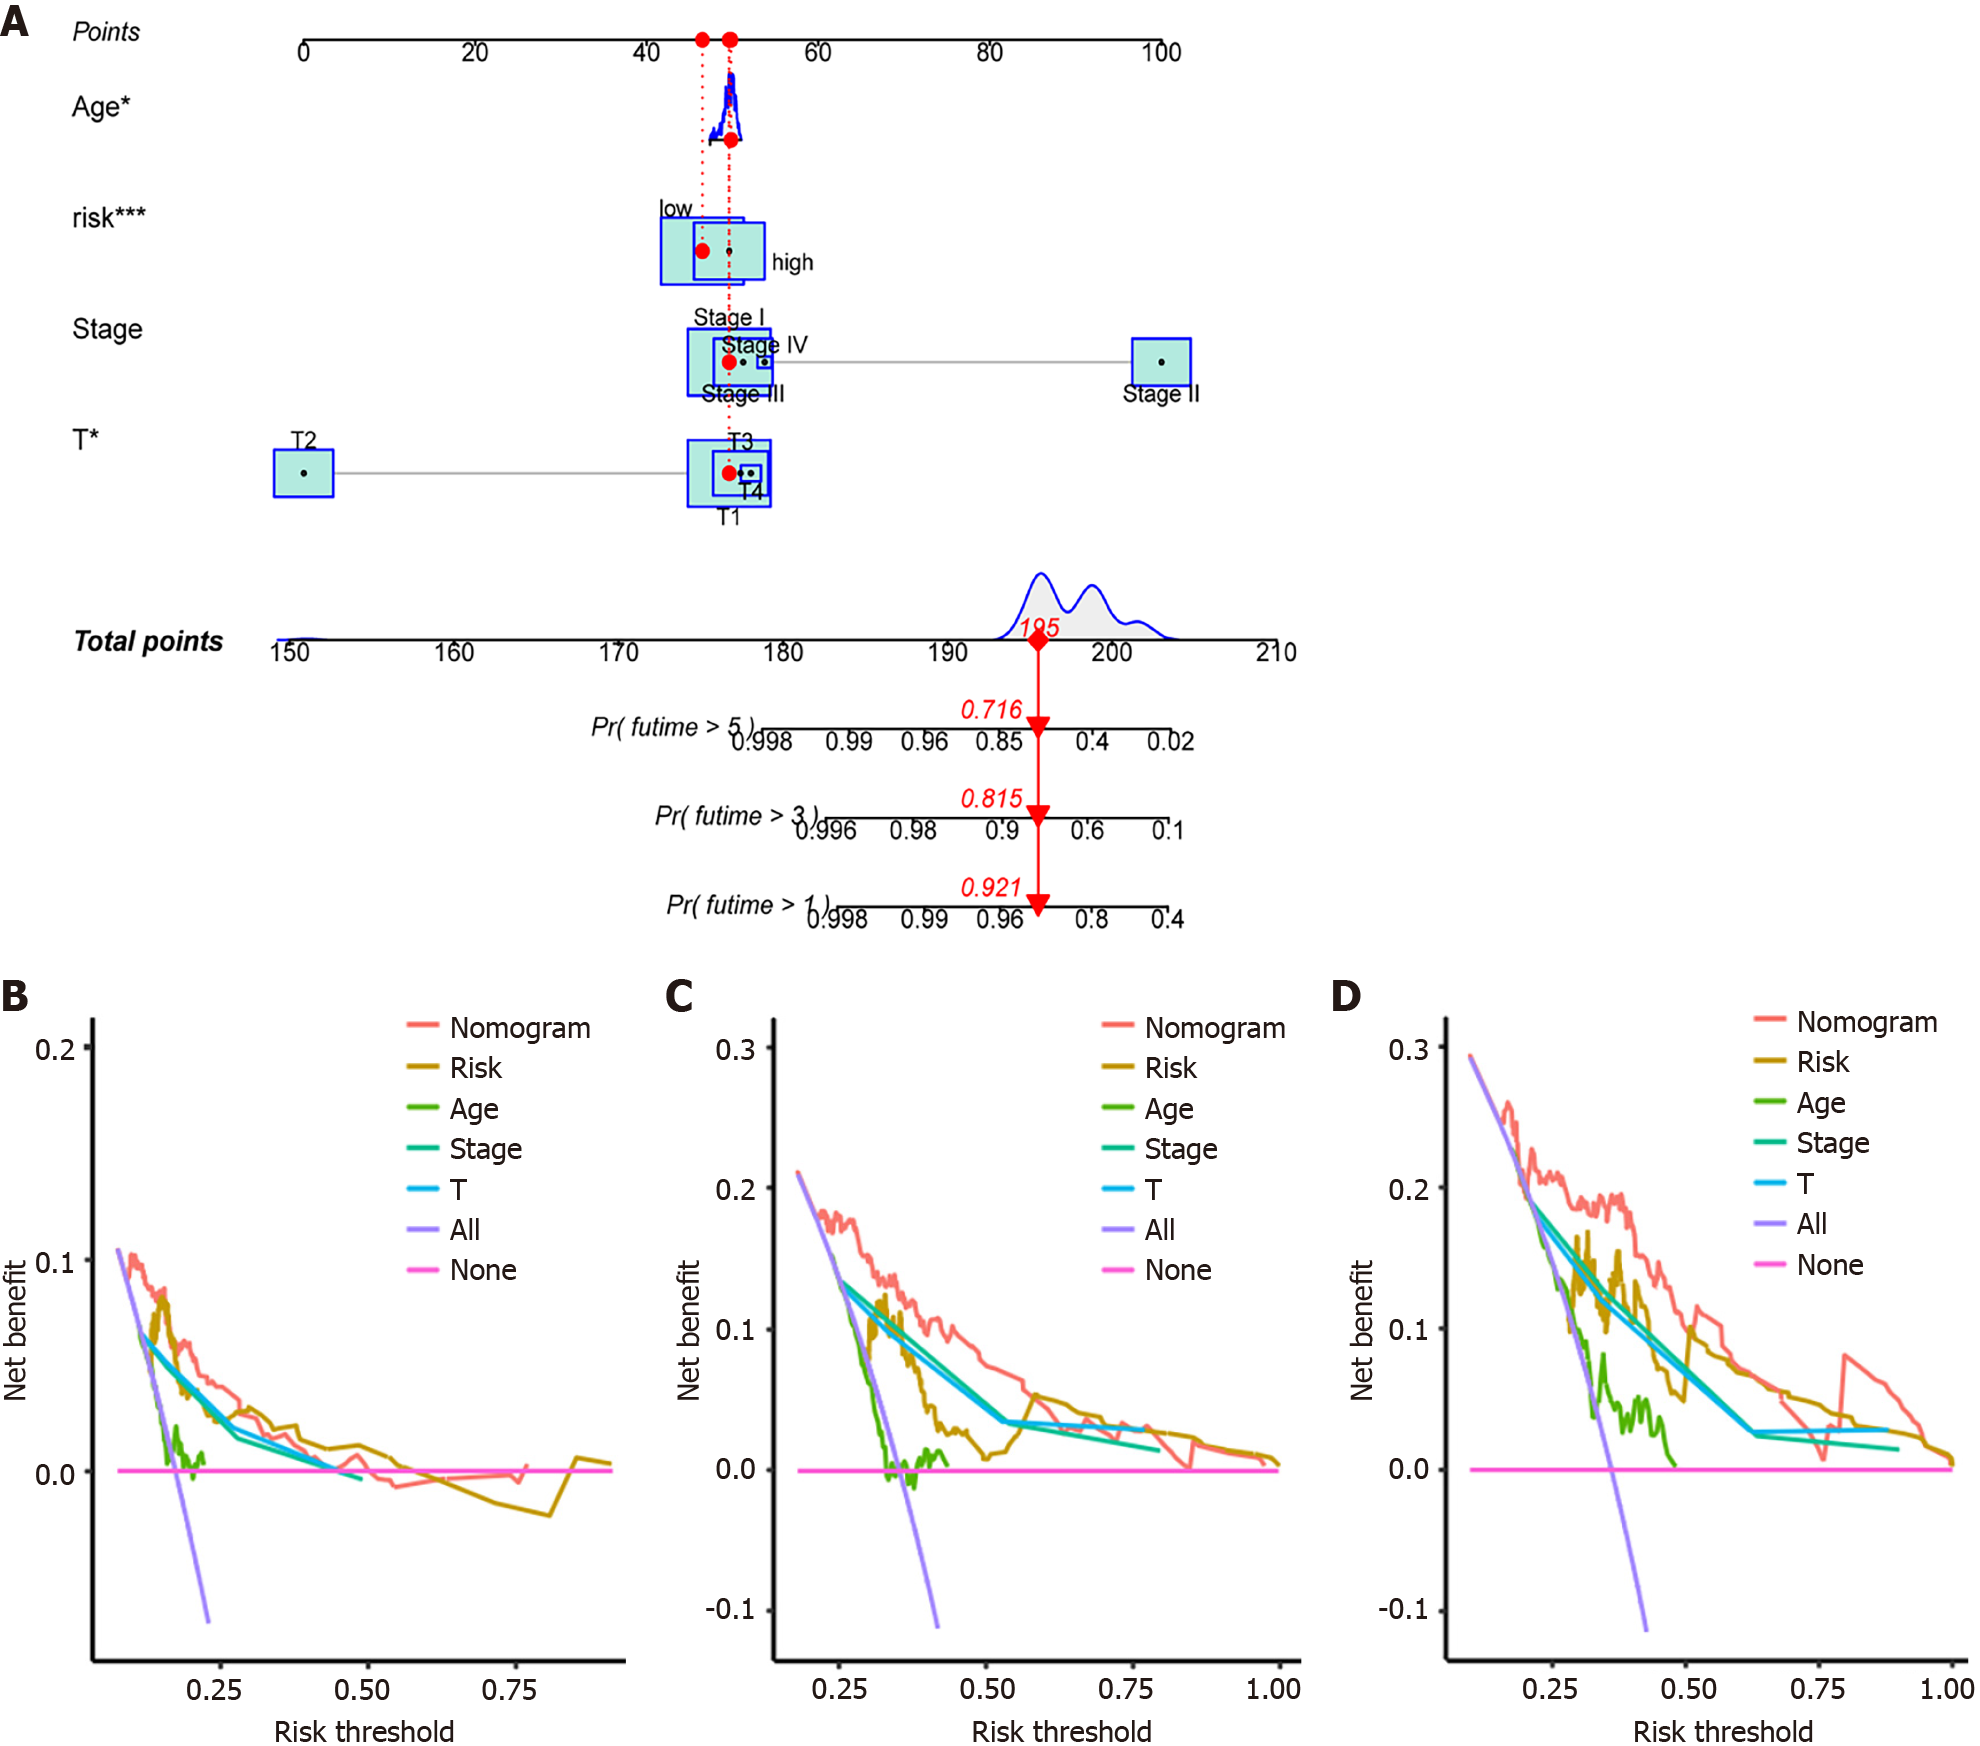
Figure 11 Prognostic model nomograms and decision curve analysis curves based on The Cancer Genome Atlas-Liver Hepatocellular Carcinoma, GSE25097, and GSE36376 combined datasets.
A: Clinical prognostic model nomogram of hepatocellular carcinoma (HCC). aP ≤ 0.05, cP ≤ 0.001; B: Decision curve analysis (DCA) curve for 1-year survival. The area under the curve represents the possible prognostic benefit for HCC patients based on this factor; C: DCA curve for 3-year survival. The area under the curve represents the possible prognostic benefit for HCC patients based on this factor; D: DCA curve for 5-year survival. The area under the curve represents the possible prognostic benefit for HCC patients based on this factor.
- Citation: Ren QS, Sun Q, Cheng SQ, Du LM, Guo PX. Hepatocellular carcinoma: An analysis of the expression status of stress granules and their prognostic value. World J Gastrointest Oncol 2024; 16(6): 2571-2591
- URL: https://www.wjgnet.com/1948-5204/full/v16/i6/2571.htm
- DOI: https://dx.doi.org/10.4251/wjgo.v16.i6.2571


