Copyright
©The Author(s) 2024.
World J Gastrointest Oncol. Jun 15, 2024; 16(6): 2571-2591
Published online Jun 15, 2024. doi: 10.4251/wjgo.v16.i6.2571
Published online Jun 15, 2024. doi: 10.4251/wjgo.v16.i6.2571
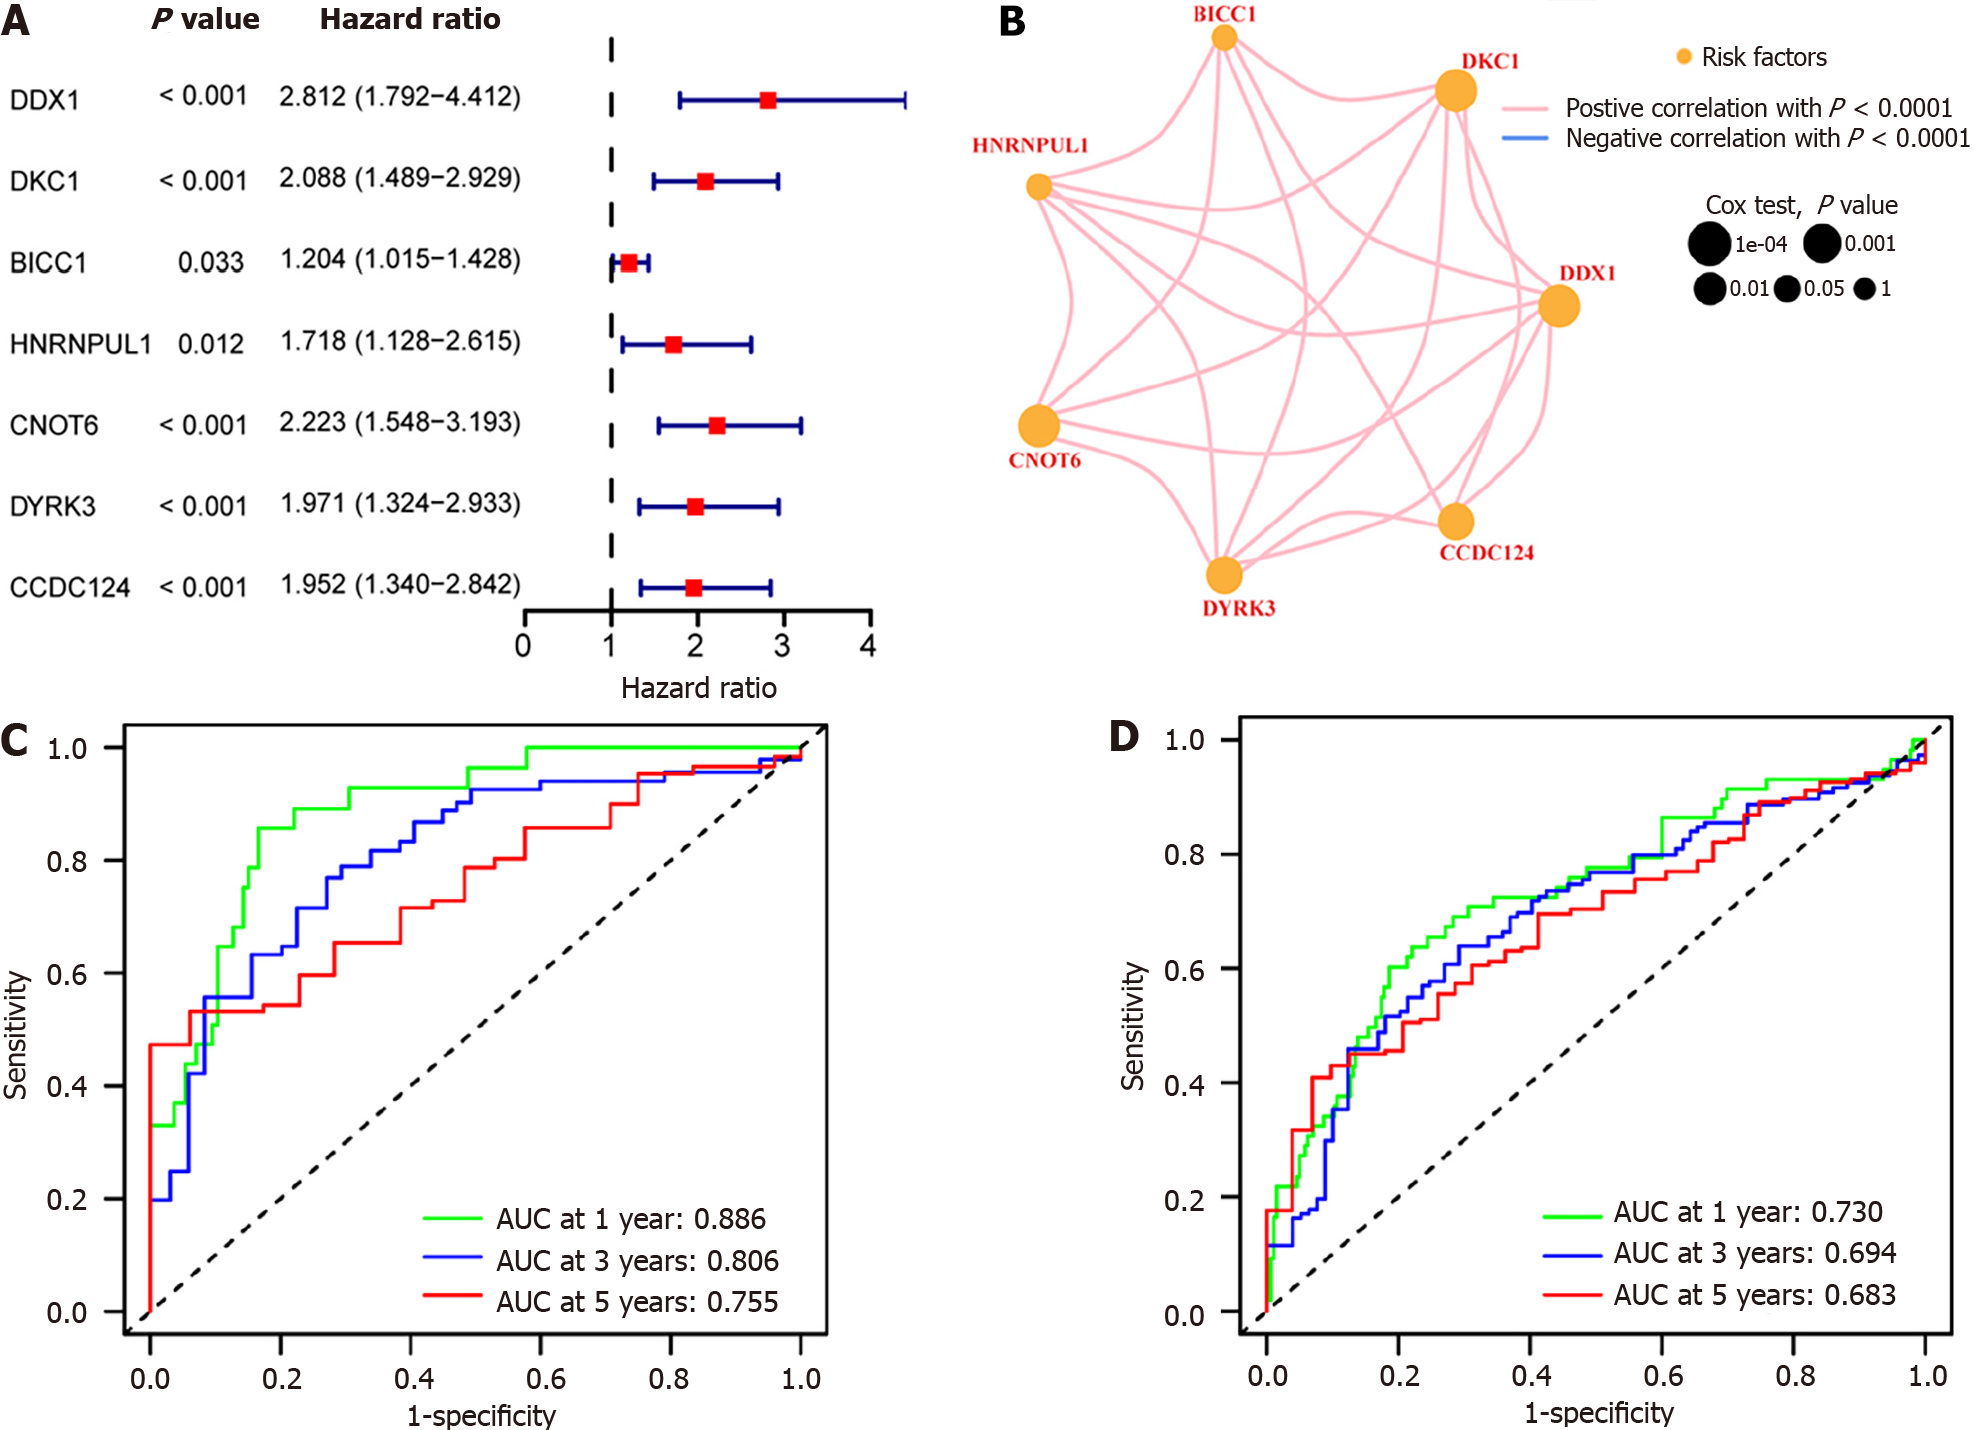
Figure 9 Hub gene association and prognosis analysis relied on The Cancer Genome Atlas-Liver Hepatocellular Carcinoma, GSE25097, and GSE36376 combined datasets.
A: Univariate Cox analysis of Hub genes in hepatocellular carcinoma (HCC). The left side of the dotted line represents hazard ratio (HR) < 1, revealing that this gene expression serves as a protective factor for the prognosis of HCC; the right side of the dotted line represents HR > 1, suggesting that this gene expression is a predictive risk factor for HCC; B: Visualization of interactions between Hub-genes. The red line indicates a positive association between the two different genes; the size of dot indicates the P value of the gene’s effect on the prognosis of HCC samples, and the orange dot represents that the gene is a risk factor for HCC; C: Receiver operating characteristic (ROC) curve. Green represents 1-year survival, blue represents 3-year survival, and red represents 5-year survival; D: ROC curve of test group. Green represents 1-year survival, blue represents 3-year survival, and red represents 5-year survival. AUC: Area under the curve.
- Citation: Ren QS, Sun Q, Cheng SQ, Du LM, Guo PX. Hepatocellular carcinoma: An analysis of the expression status of stress granules and their prognostic value. World J Gastrointest Oncol 2024; 16(6): 2571-2591
- URL: https://www.wjgnet.com/1948-5204/full/v16/i6/2571.htm
- DOI: https://dx.doi.org/10.4251/wjgo.v16.i6.2571


