Copyright
©The Author(s) 2024.
World J Gastrointest Oncol. Jun 15, 2024; 16(6): 2571-2591
Published online Jun 15, 2024. doi: 10.4251/wjgo.v16.i6.2571
Published online Jun 15, 2024. doi: 10.4251/wjgo.v16.i6.2571
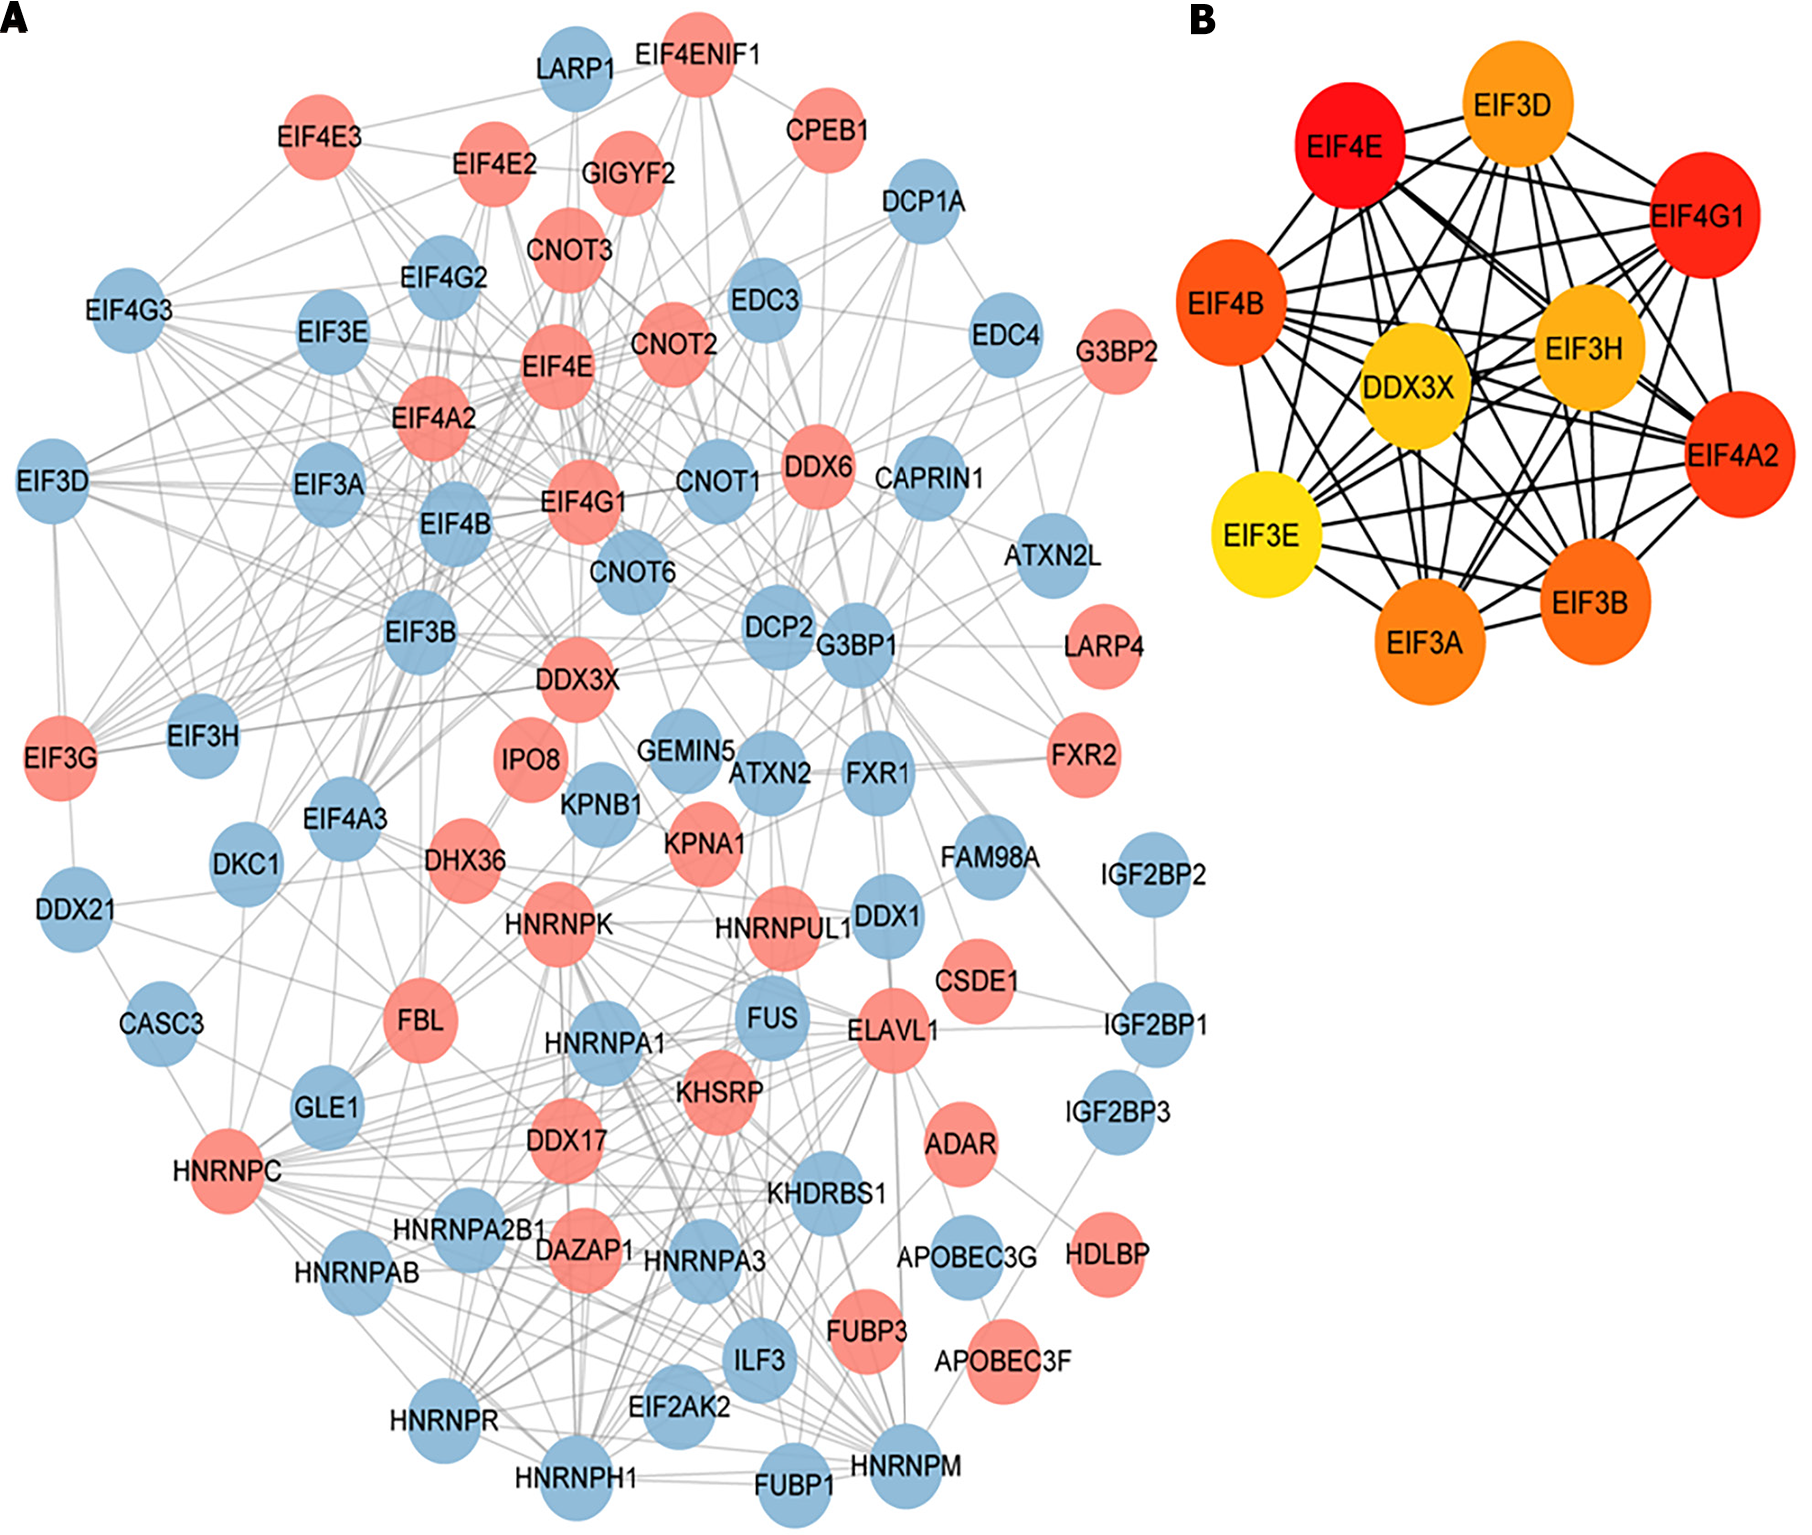
Figure 8 Protein-protein interaction analysis.
A: Protein-protein interaction analysis was conducted utilizing the STRING database for kinetokines-related genes, and the visualization of interaction relationship was carried out, where red indicates up-regulated genes and blue indicates downregulated genes; B: The resulting top 10 hub genes were analyzed utilizing the CytoHubba plug-in.
- Citation: Ren QS, Sun Q, Cheng SQ, Du LM, Guo PX. Hepatocellular carcinoma: An analysis of the expression status of stress granules and their prognostic value. World J Gastrointest Oncol 2024; 16(6): 2571-2591
- URL: https://www.wjgnet.com/1948-5204/full/v16/i6/2571.htm
- DOI: https://dx.doi.org/10.4251/wjgo.v16.i6.2571


