Copyright
©The Author(s) 2024.
World J Gastrointest Oncol. Jun 15, 2024; 16(6): 2571-2591
Published online Jun 15, 2024. doi: 10.4251/wjgo.v16.i6.2571
Published online Jun 15, 2024. doi: 10.4251/wjgo.v16.i6.2571
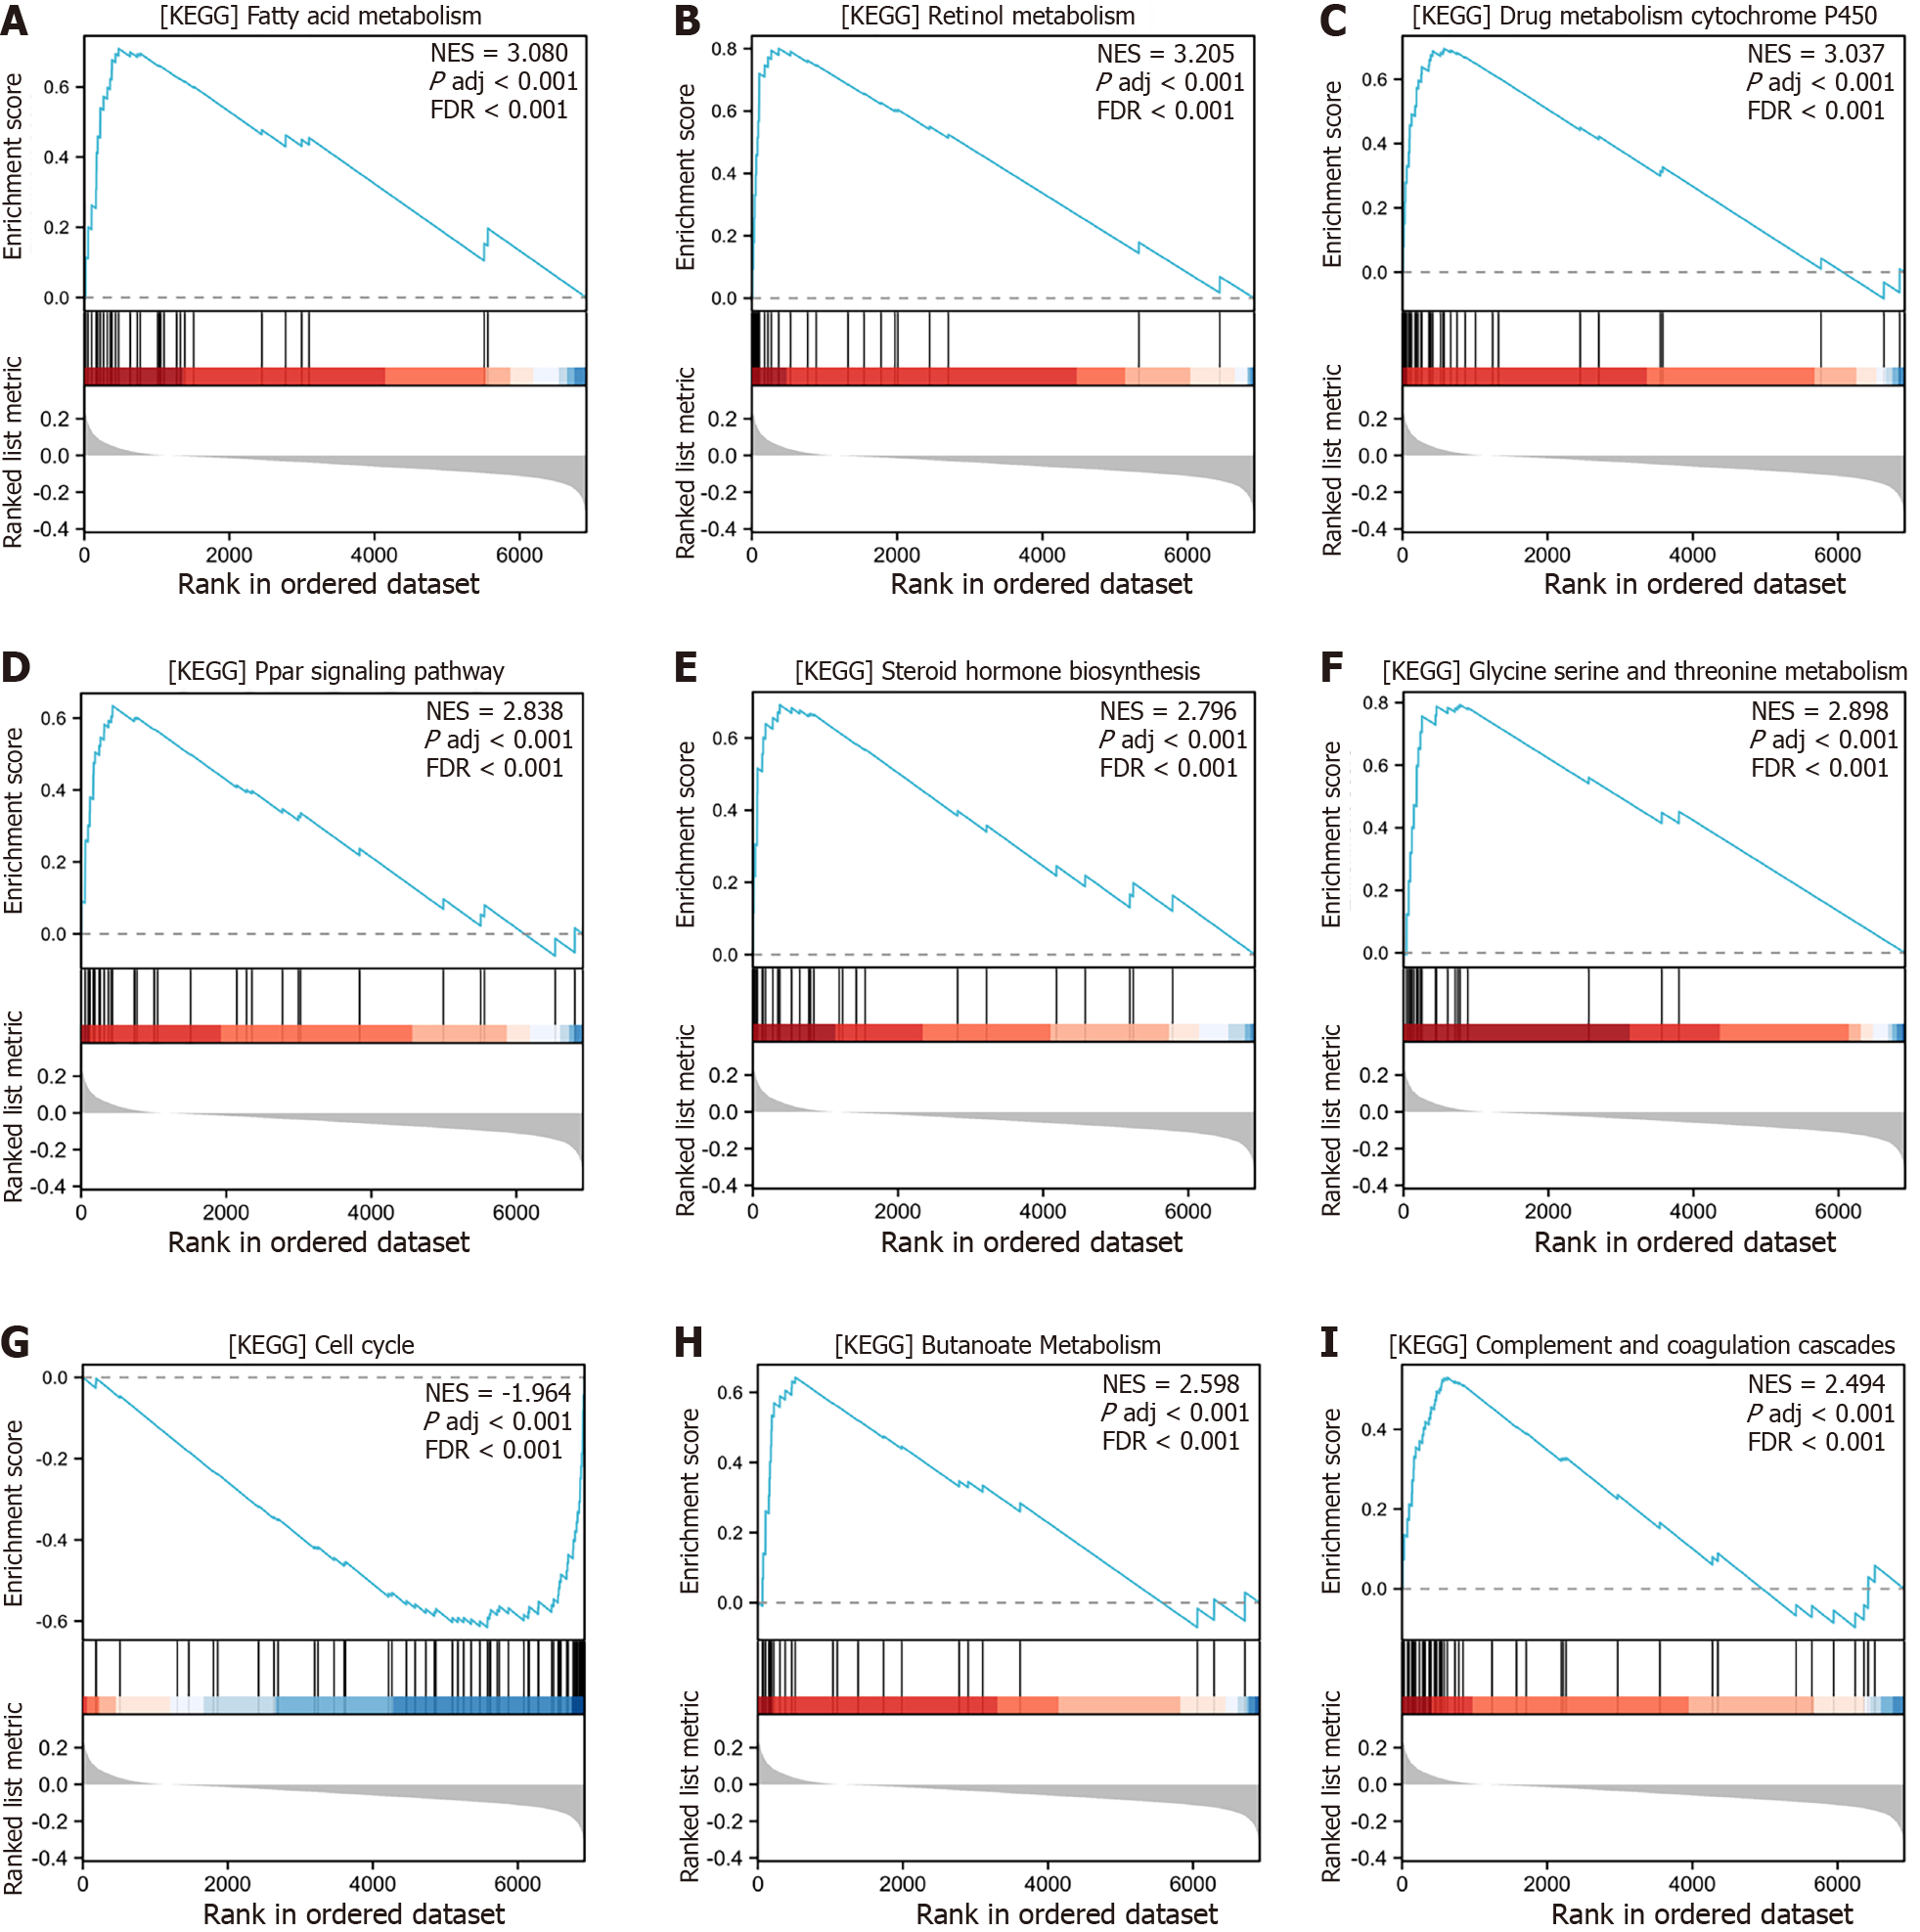
Figure 7 Gene Set Enrichment Analysis of differentially expressed genes between high- and low-risk groups in The Cancer Genome Atlas-Liver Hepatocellular Carcinoma, GSE25097, and GSE36376 combined datasets.
A: Gene Set Enrichment Analysis (GSEA) analysis illustrated that low risk was significantly up-regulated within the KEGG_FATTY_ACID_METABOLISM pathway compared to high risk; B: GSEA analysis illustrated that low risk was significantly up-regulated within the KEGG_RETINOL_METABOLISM pathway compared to high risk; C: GSEA analysis illustrated that low risk was significantly up-regulated within the KEGG_DRUG_METABOLISM_CYTOCHROME_P450 pathway compared to high risk; D: GSEA analysis illustrated that low risk was significantly up-regulated within the KEGG_PPAR_SIGNALING_PATHWAY pathway compared to high risk; E: GSEA analysis illustrated that low risk was significantly up-regulated within the KEGG_STEROID_HORMONE_BIOSYNTHESIS pathway compared to high risk; F: GSEA analysis illustrated that low risk was significantly up-regulated within the KEGG_GLYCINE_SERINE_AND_THREONINE_METABOLISM pathway compared to high risk; G: GSEA analysis illustrated that low risk was significantly down-regulated within the KEGG_CELL_CYCLE pathway compared to high risk; H: GSEA analysis illustrated that low risk was significantly up-regulated within the KEGG_BUTANOATE_METABOLISM pathway compared to high risk; I: GSEA analysis illustrated that low risk was significantly up-regulated within the KEGG_COMPLEMENT_AND_COAGULATION_CASCADES pathway compared to high risk. KEGG: Kyoto Encyclopedia of Genes and Genomes.
- Citation: Ren QS, Sun Q, Cheng SQ, Du LM, Guo PX. Hepatocellular carcinoma: An analysis of the expression status of stress granules and their prognostic value. World J Gastrointest Oncol 2024; 16(6): 2571-2591
- URL: https://www.wjgnet.com/1948-5204/full/v16/i6/2571.htm
- DOI: https://dx.doi.org/10.4251/wjgo.v16.i6.2571


