Copyright
©The Author(s) 2024.
World J Gastrointest Oncol. Jun 15, 2024; 16(6): 2571-2591
Published online Jun 15, 2024. doi: 10.4251/wjgo.v16.i6.2571
Published online Jun 15, 2024. doi: 10.4251/wjgo.v16.i6.2571
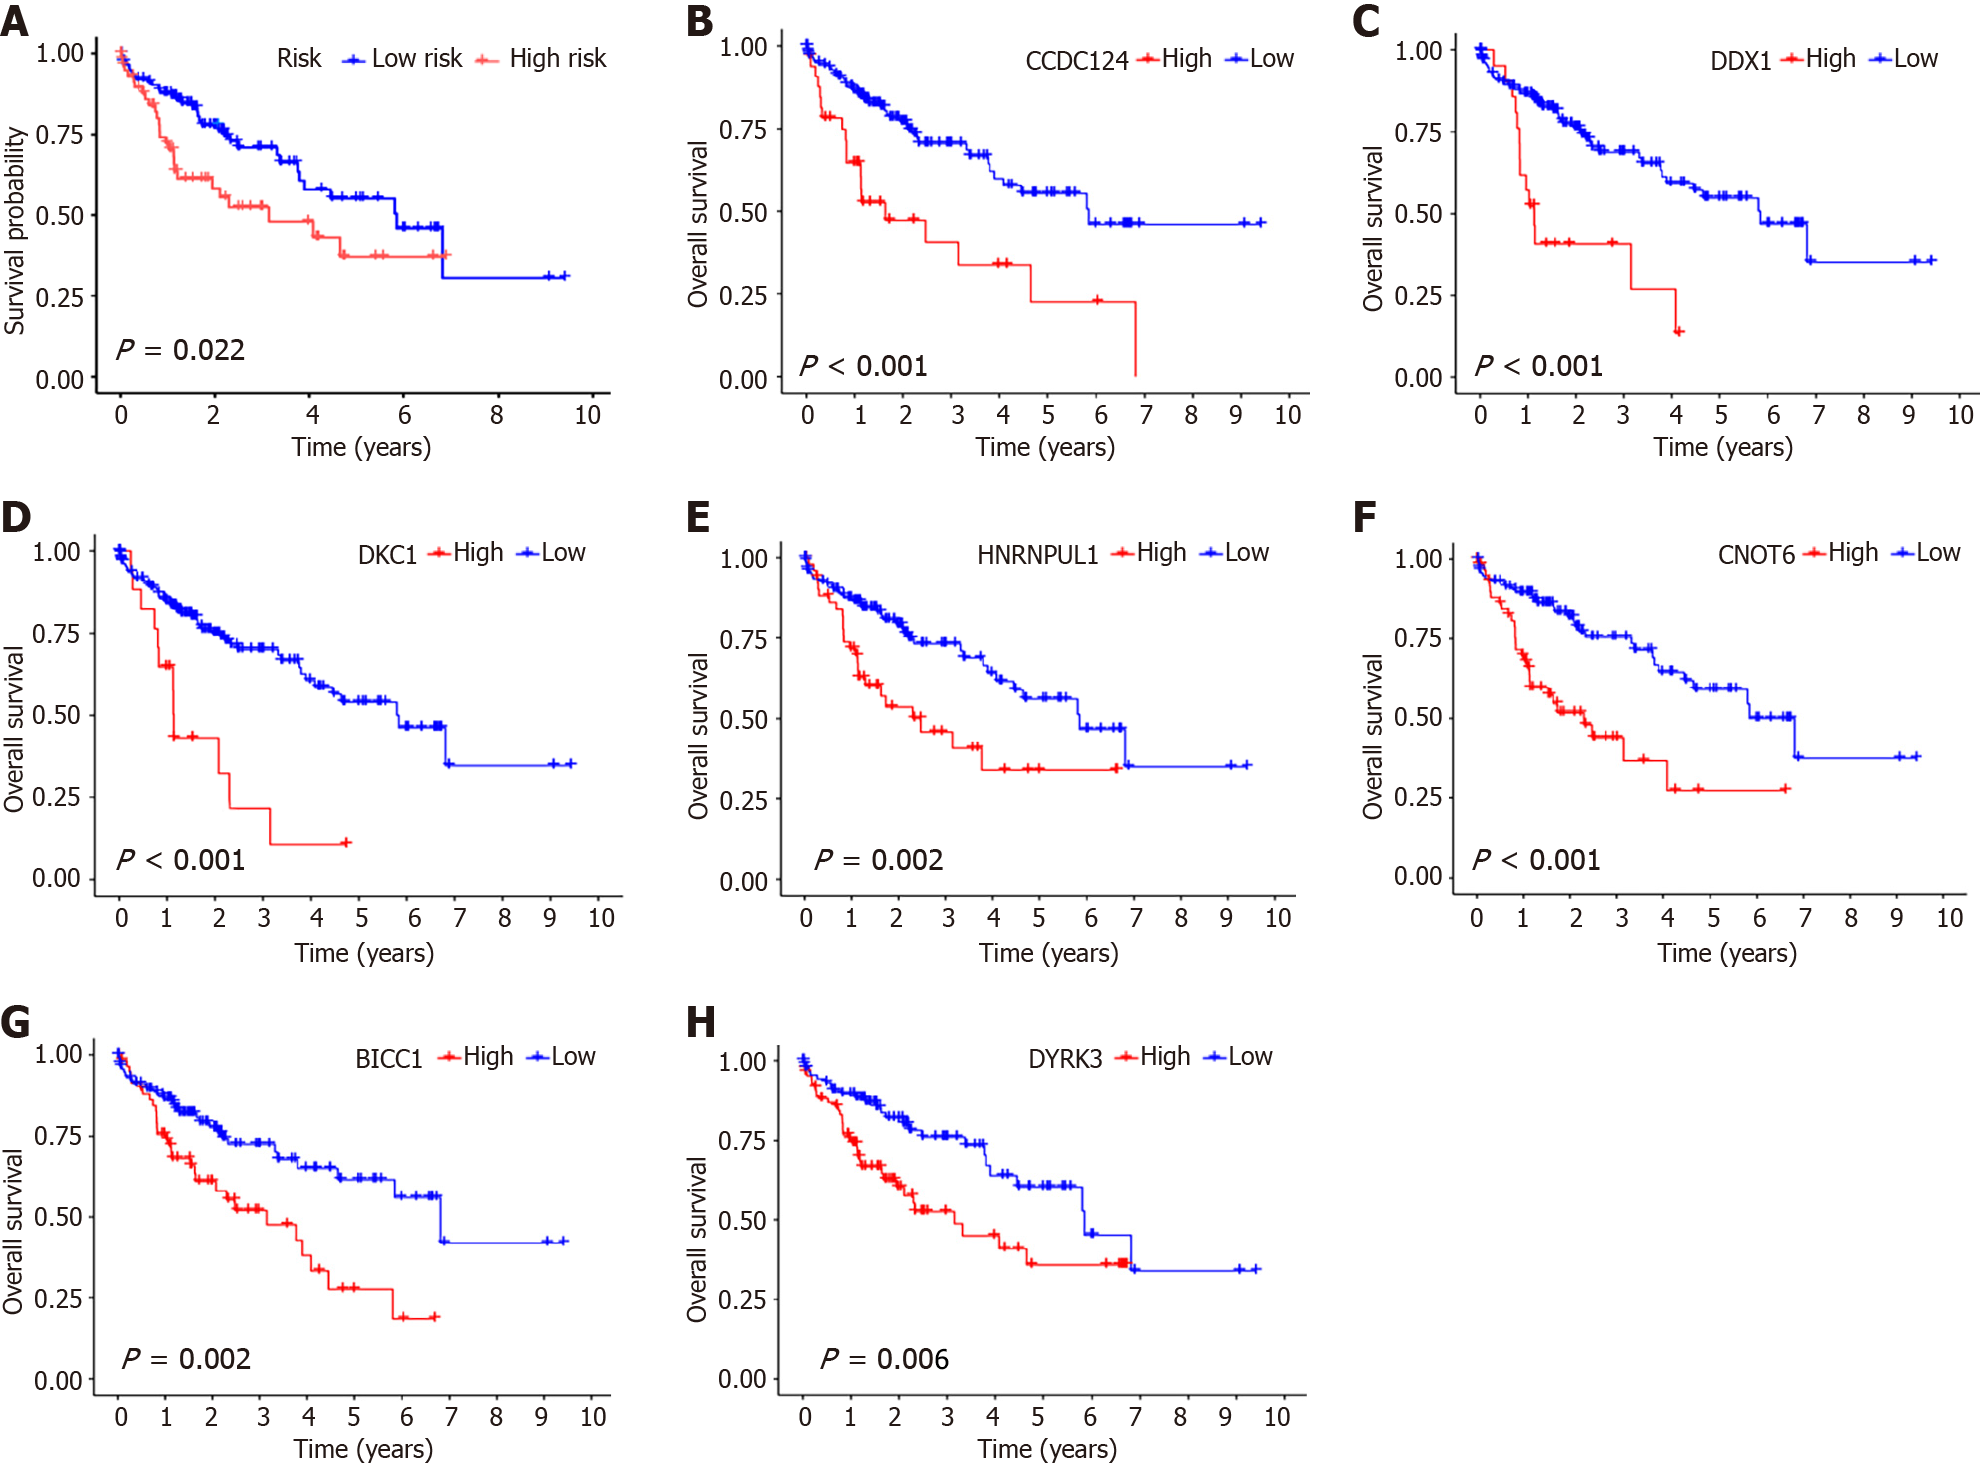
Figure 4 Hub genes survival analysis within the test group.
A: Survival analysis of risk scores for test group samples. Red represents high-risk group samples, and blue indicates low-risk group samples; B: Survival analysis of CCDC124 samples in the test group. Red indicates high-risk group samples, and blue represents low-risk group samples; C: Survival analysis of DDX1 in test group samples. Red indicates high-risk group samples, and blue indicates low-risk group samples; D: Survival analysis of DKC1 in test group samples. Red represents high-risk group samples, and blue indicates low-risk group samples; E: Survival analysis of HNRNPUL1 in the test group. Red represents high-risk group samples, and blue indicates low-risk group samples; F: Survival analysis of CNOT6 in test group samples. Red indicates high-risk group samples, and blue indicates low-risk group samples; G: Survival analysis of BICC1 in test group samples. Red indicates high-risk group samples, and blue indicates low-risk group samples; H: Survival analysis of DYRK3 in test group samples. Red indicates high-risk group samples, and blue indicates low-risk group samples.
- Citation: Ren QS, Sun Q, Cheng SQ, Du LM, Guo PX. Hepatocellular carcinoma: An analysis of the expression status of stress granules and their prognostic value. World J Gastrointest Oncol 2024; 16(6): 2571-2591
- URL: https://www.wjgnet.com/1948-5204/full/v16/i6/2571.htm
- DOI: https://dx.doi.org/10.4251/wjgo.v16.i6.2571


