Copyright
©The Author(s) 2024.
World J Gastrointest Oncol. Jun 15, 2024; 16(6): 2504-2519
Published online Jun 15, 2024. doi: 10.4251/wjgo.v16.i6.2504
Published online Jun 15, 2024. doi: 10.4251/wjgo.v16.i6.2504
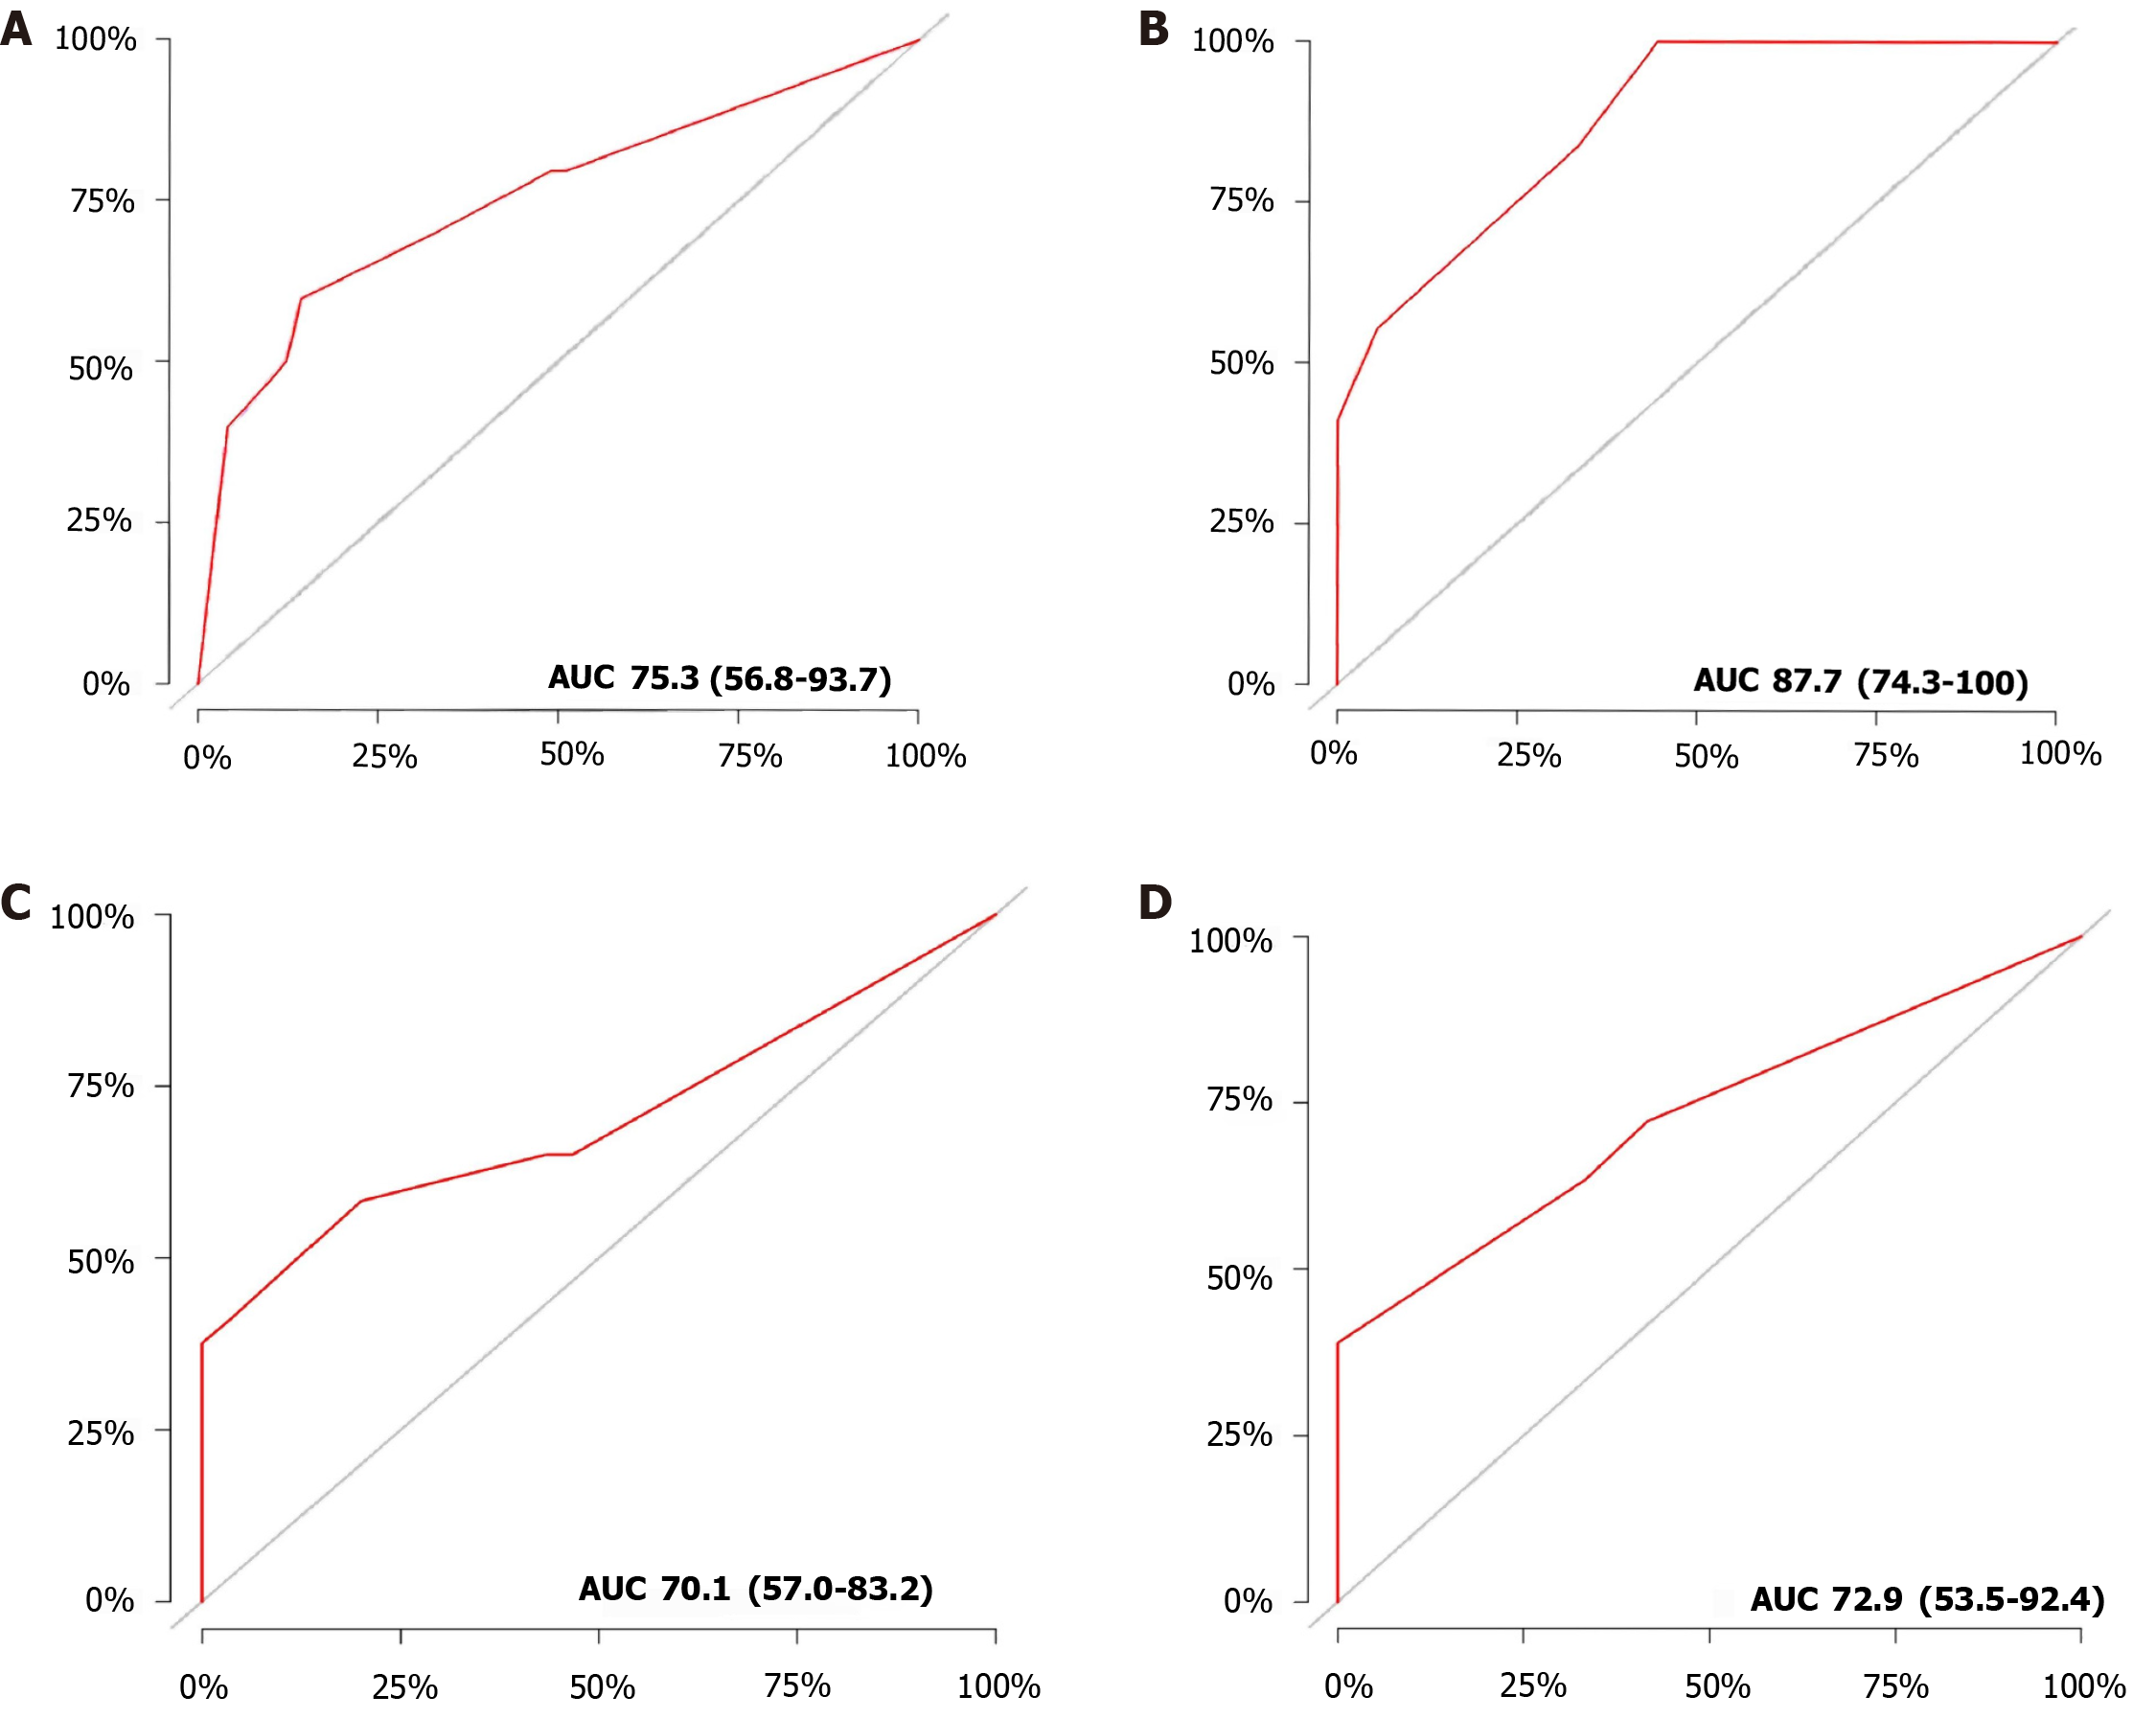
Figure 4 Graph showing the operating characteristic evaluation plot for prognostic model.
A: Graph showing the training set receiver operating characteristic (ROC) evaluation plot for 9-month prognostic prediction model; B: Graph showing the validation set ROC evaluation plot for 9-month prognostic prediction model; C: Graph showing the training set ROC evaluation plot for 12-month prognostic prediction model; D: Graph showing the validation set ROC evaluation plot for 12-month prognostic prediction model. AUC: Aure under the curve.
- Citation: Pan D, Liu HN, Yao ZY, Chen XX, Li YQ, Zhu JJ, Han ZX, Qin XB. Impact of baseline hepatitis B virus viral load on the long-term prognosis of advanced hepatocellular carcinoma treated with immunotherapy. World J Gastrointest Oncol 2024; 16(6): 2504-2519
- URL: https://www.wjgnet.com/1948-5204/full/v16/i6/2504.htm
- DOI: https://dx.doi.org/10.4251/wjgo.v16.i6.2504


