Copyright
©The Author(s) 2024.
World J Gastrointest Oncol. Jun 15, 2024; 16(6): 2504-2519
Published online Jun 15, 2024. doi: 10.4251/wjgo.v16.i6.2504
Published online Jun 15, 2024. doi: 10.4251/wjgo.v16.i6.2504
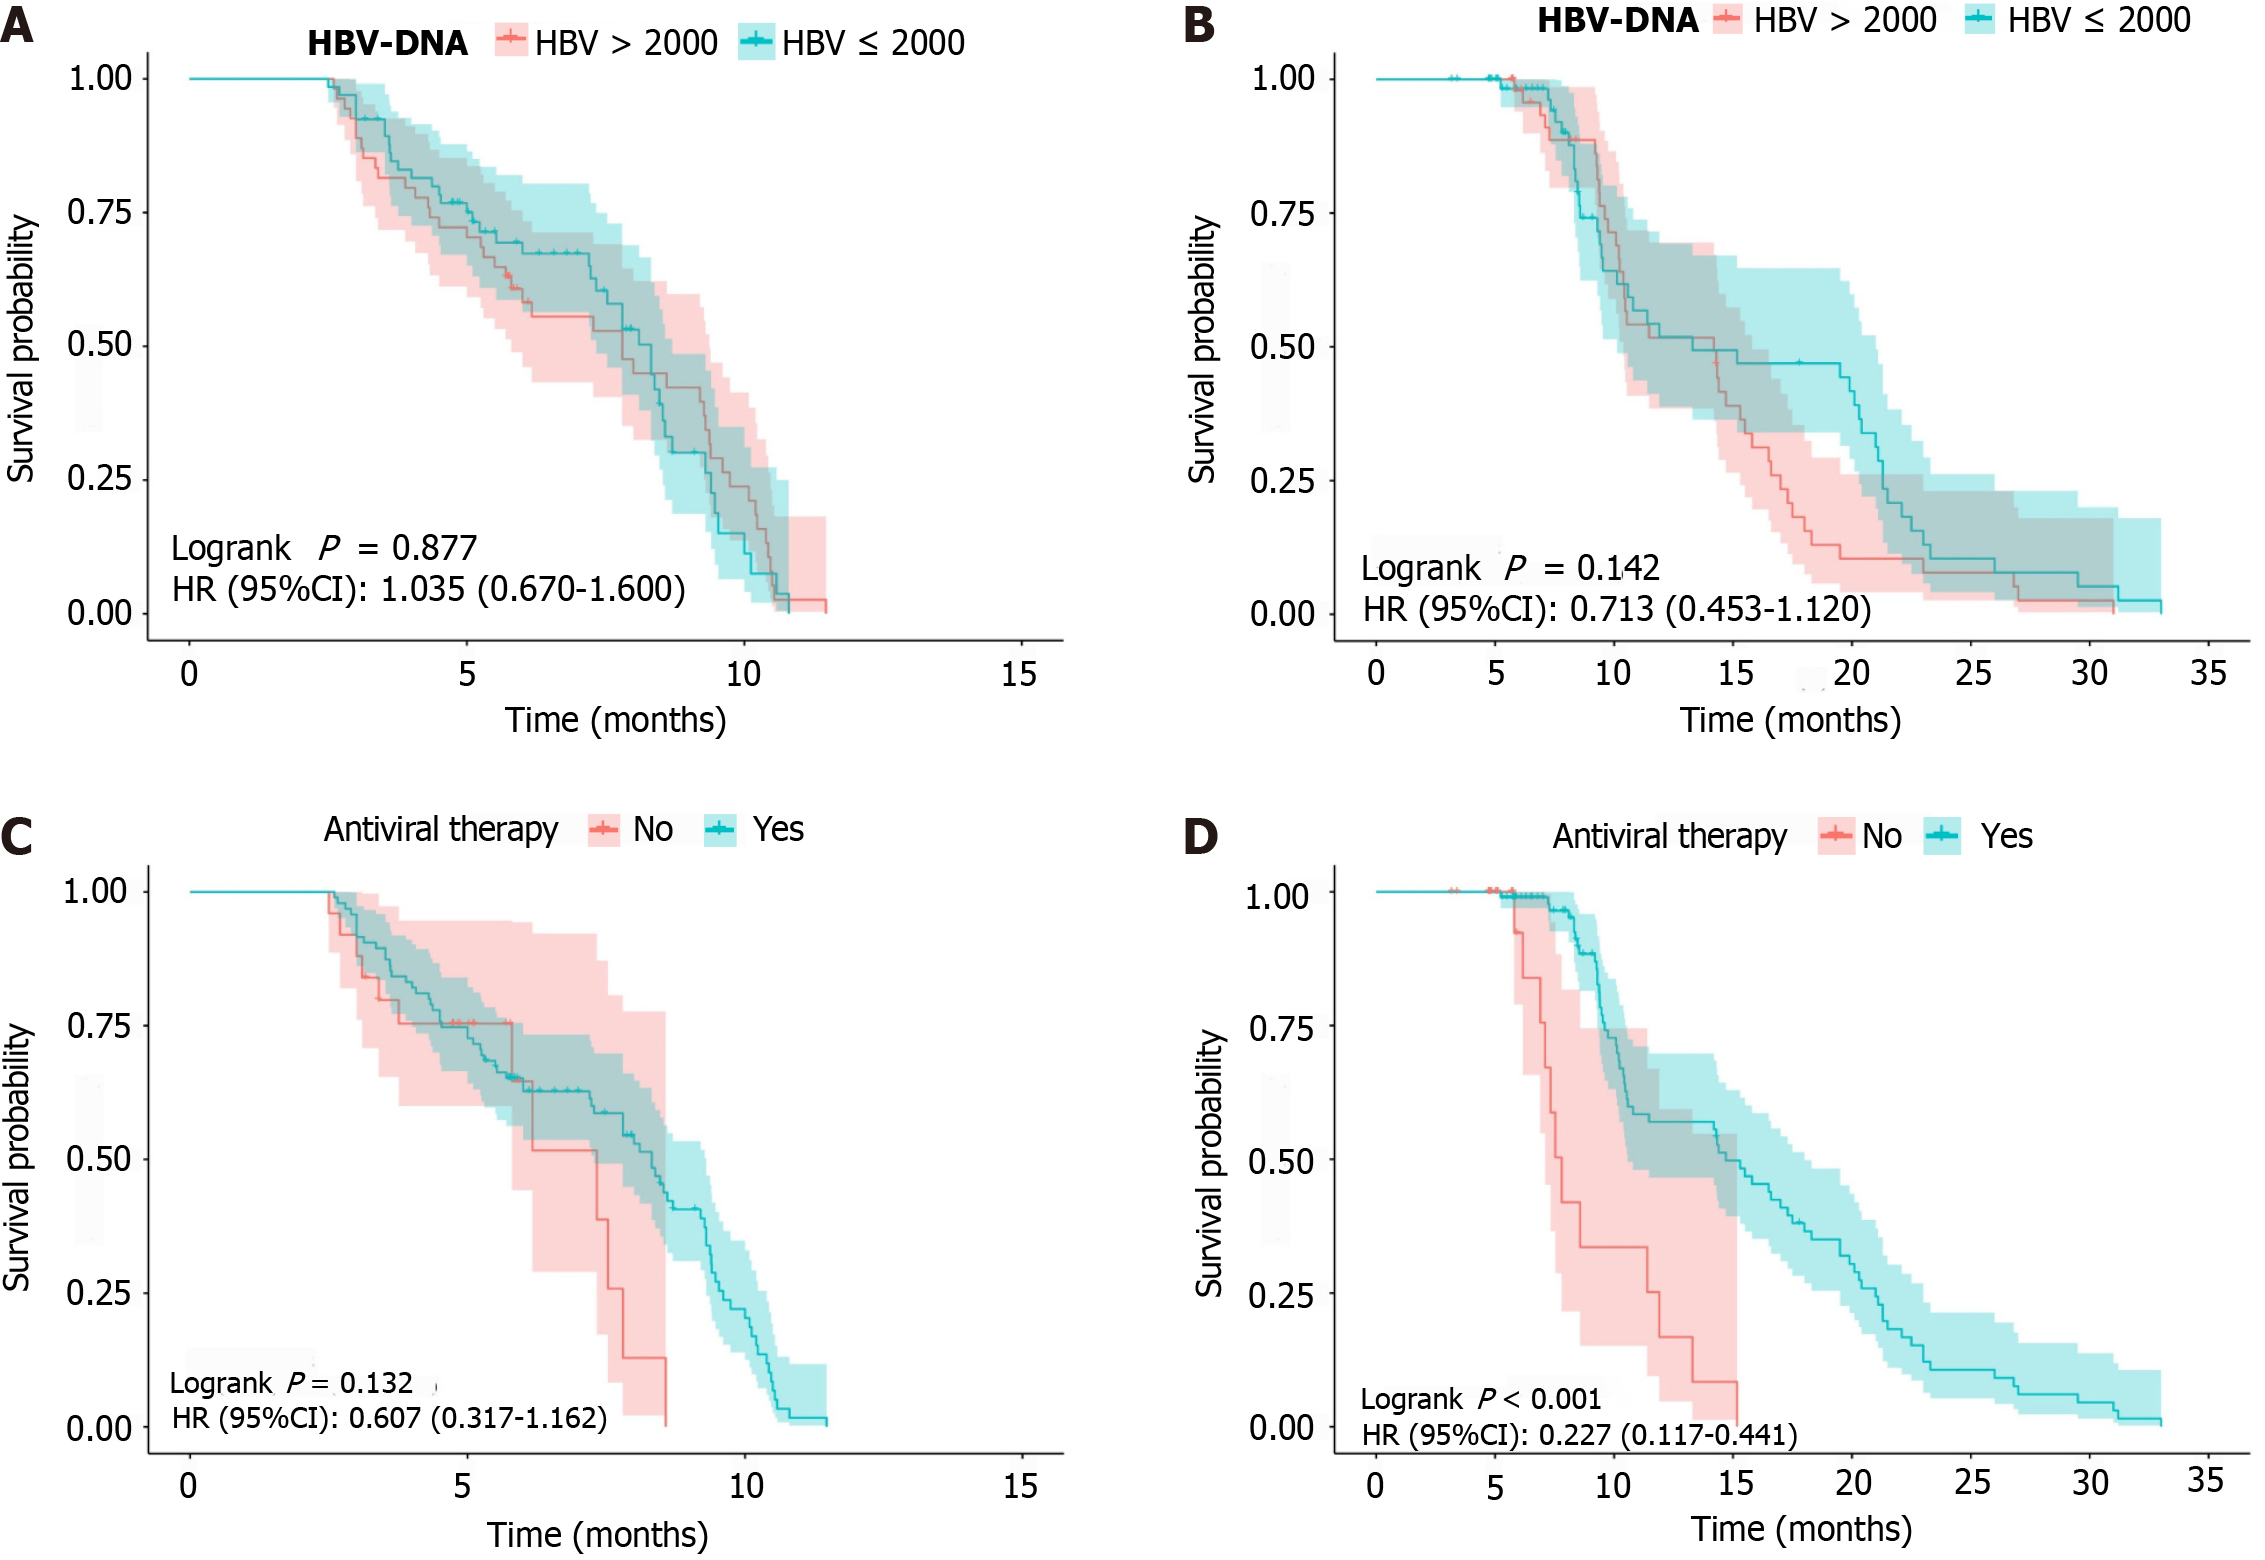
Figure 2 Graph showing the effect of different levels of hepatitis B virus-DNA on long-term survival of patients and further subgroup analysis according to antiviral treatment.
A: Kaplan Meier plot of progression-free survival in the hepatitis B virus (HBV)-DNA ≤ 2000 and HBV-DNA > 2000 groups; B: Kaplan Meier plot of overall survival (OS) in the HBV-DNA ≤ 2000 and HBV-DNA > 2000 groups; C: Kaplan Meier plot of Analysis of progression-free survival subgroup by antiviral therapy; D: Kaplan Meier plot of Analysis of OS subgroup by antiviral therapy. HBV: Hepatitis B virus.
- Citation: Pan D, Liu HN, Yao ZY, Chen XX, Li YQ, Zhu JJ, Han ZX, Qin XB. Impact of baseline hepatitis B virus viral load on the long-term prognosis of advanced hepatocellular carcinoma treated with immunotherapy. World J Gastrointest Oncol 2024; 16(6): 2504-2519
- URL: https://www.wjgnet.com/1948-5204/full/v16/i6/2504.htm
- DOI: https://dx.doi.org/10.4251/wjgo.v16.i6.2504


